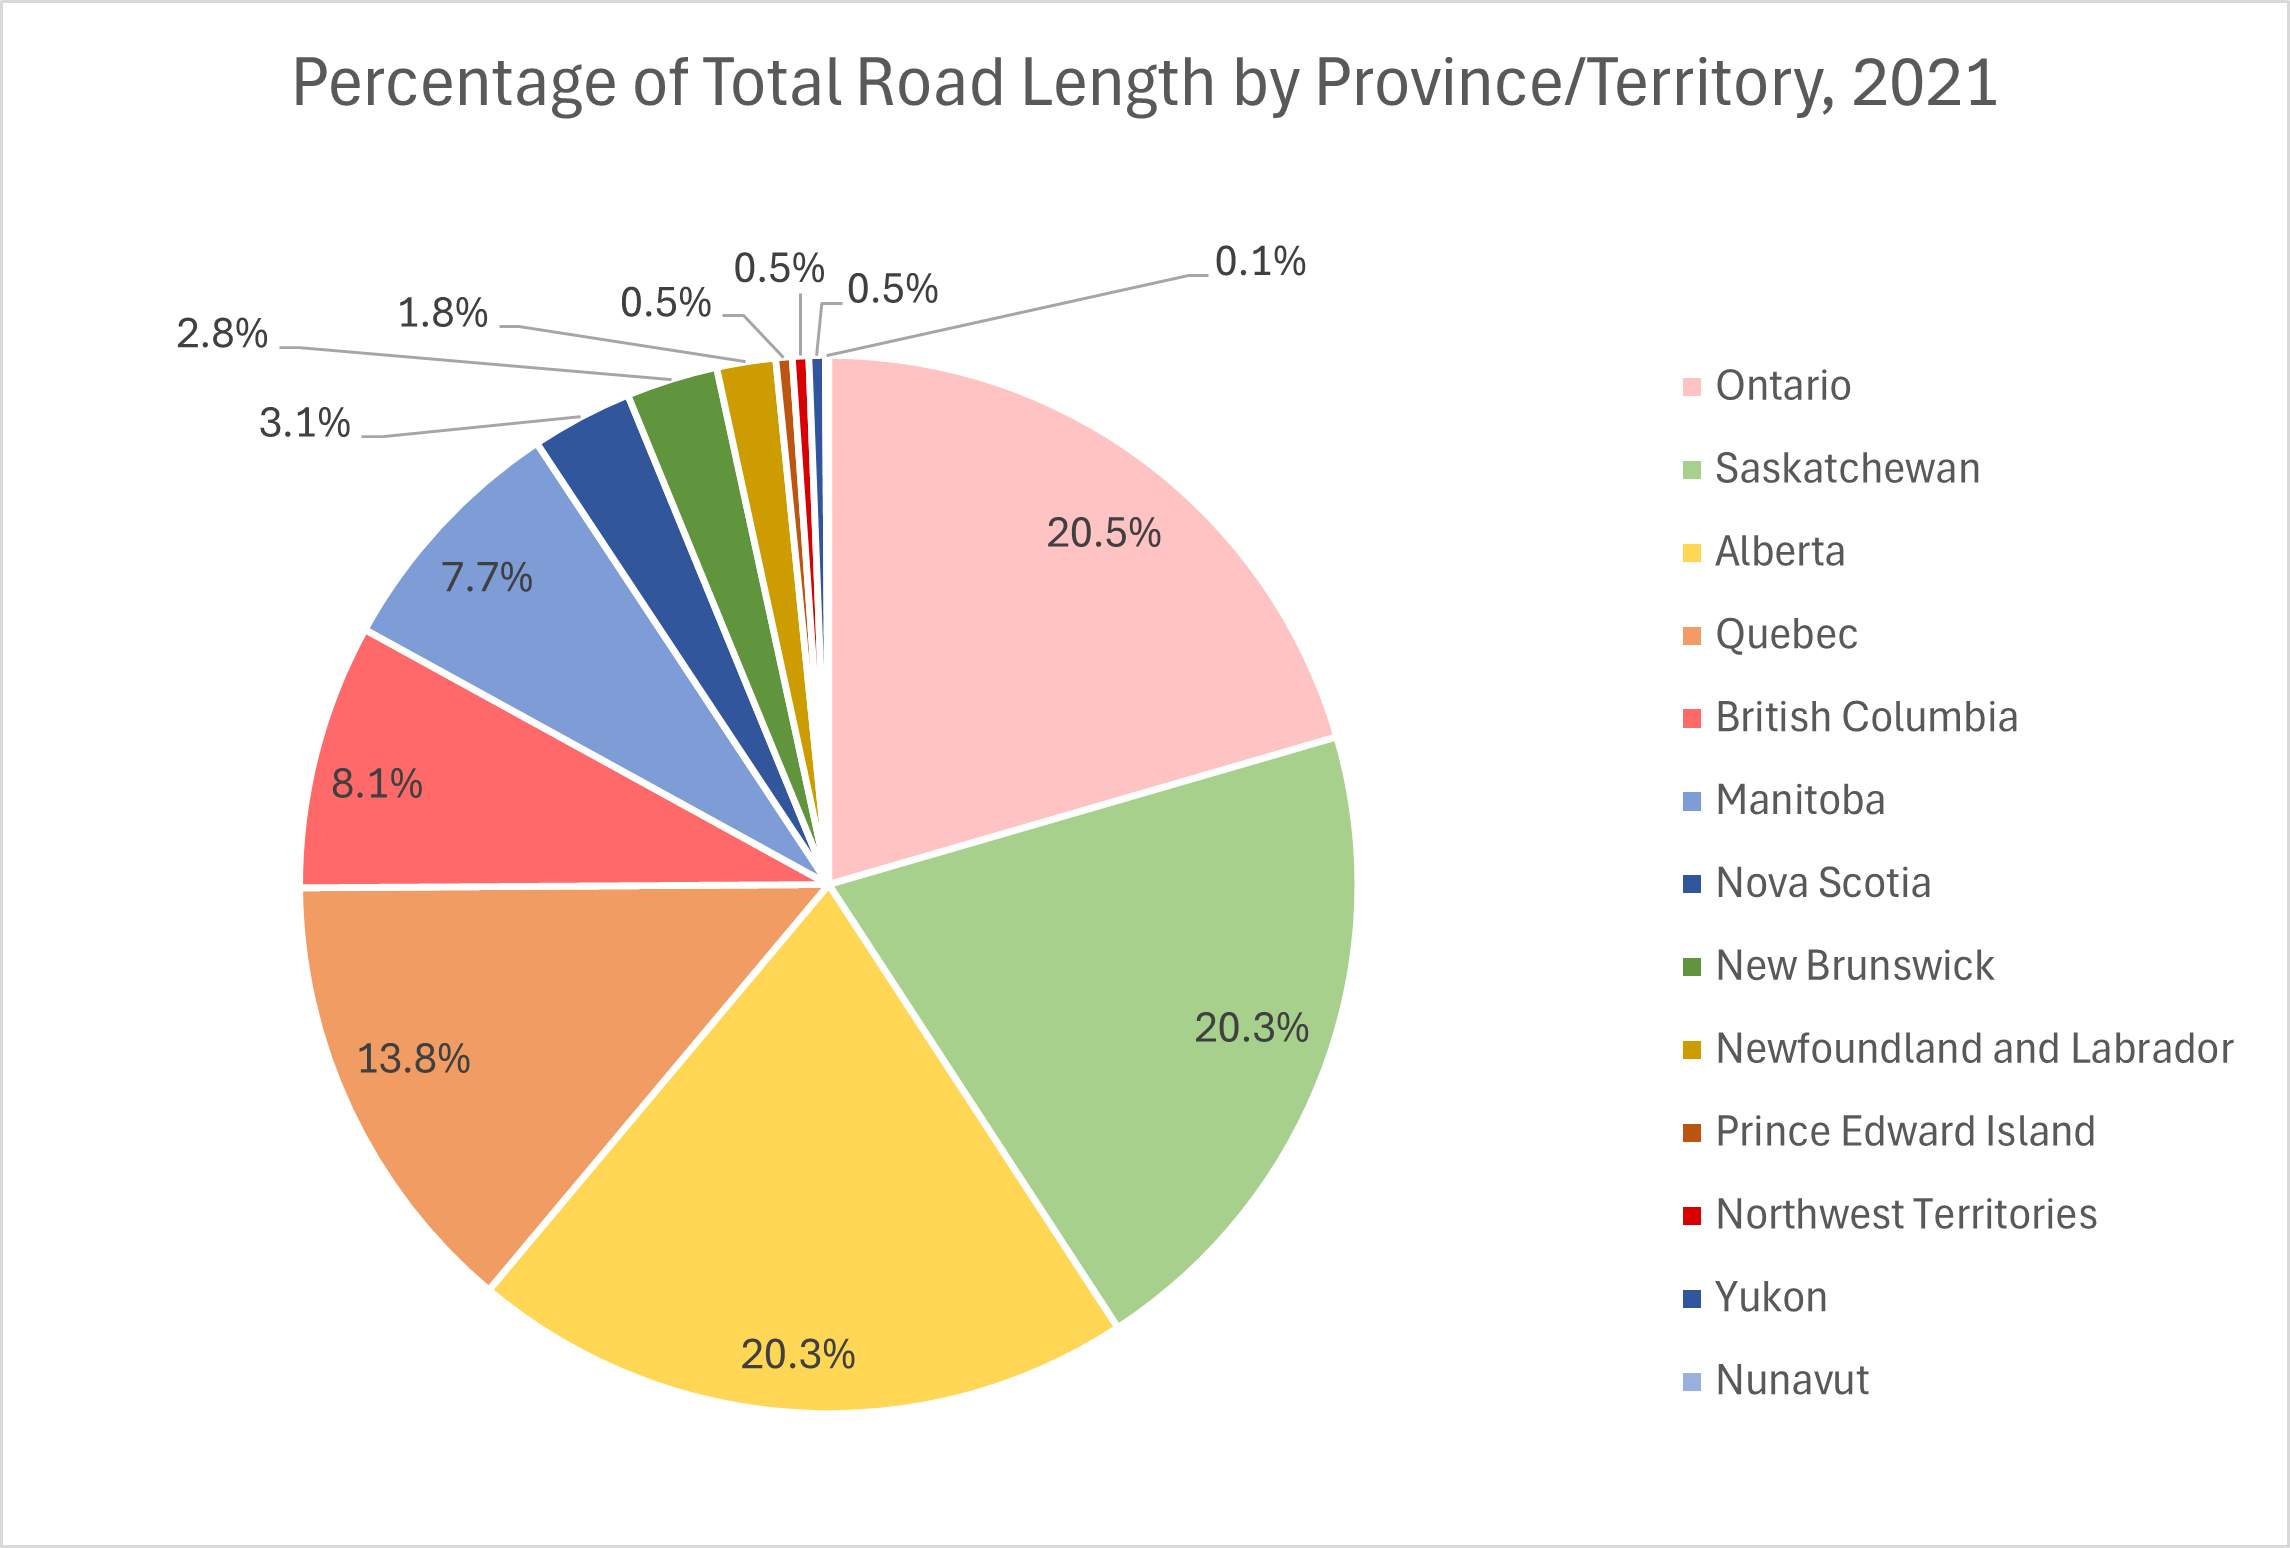
- In 2023, Canada had over 1.13 million kilometres of public roads – longer than a round trip to the Moon. Ontario, Quebec, Saskatchewan, and Alberta accounted for over 75% of the total road length. About 40% of the entire road network was paved. The following chart provides a breakdown by province and territory in 2021, the most recent year for which detailed data is available. (Transport Canada, 2024)
- Canada’s National Highway System (NHS) includes more than 38,098 lane-kilometres of roadway. 72.8% of the roads are classified as “core” routes, 11.7% are classified as “feeder” routes, and 15.5% are classified as “Northern and remote” routes. (Transport Canada, 2024)
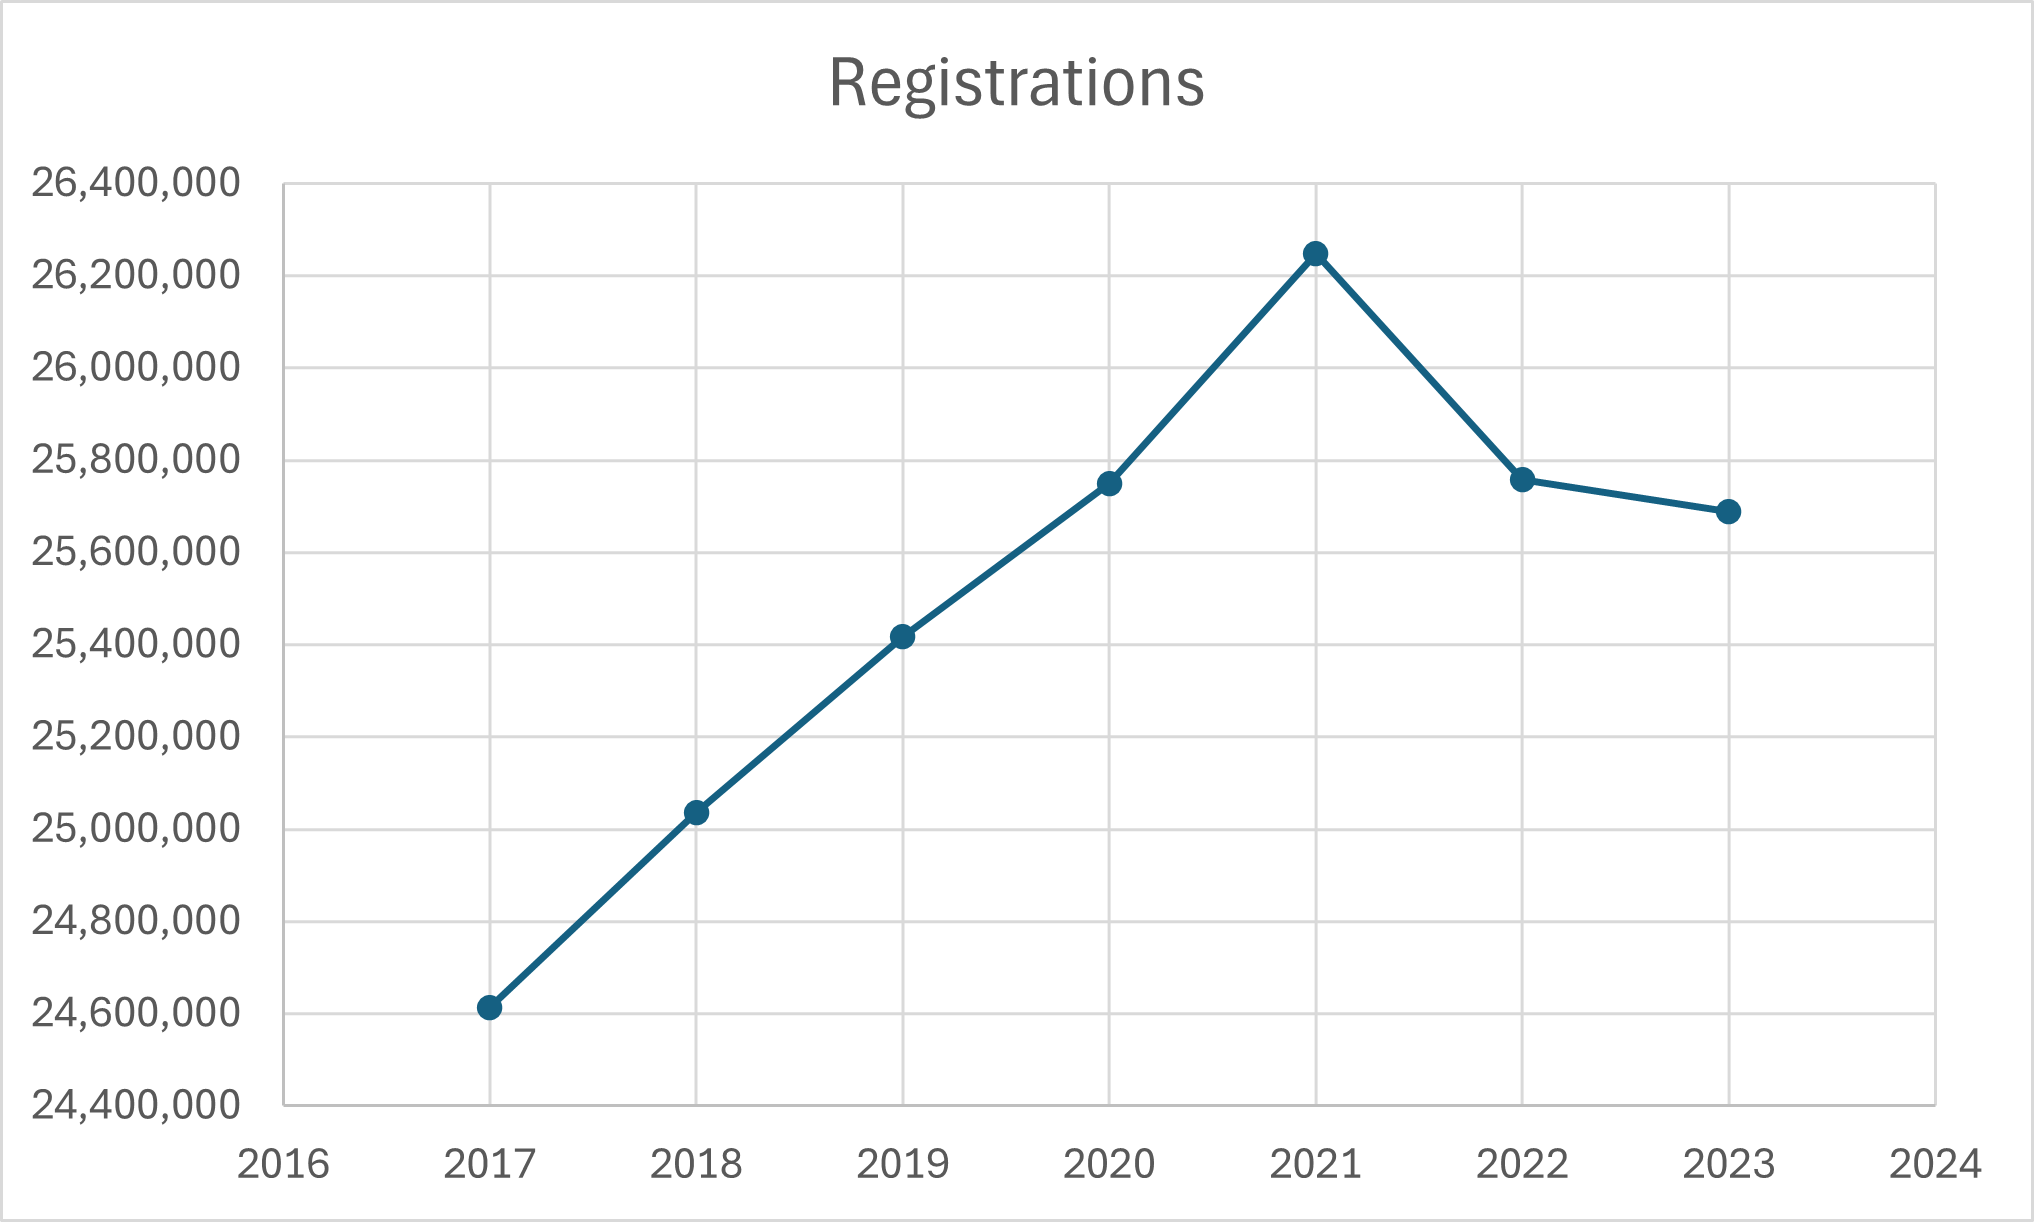
- In 2023, there were 25,688,408 registered road motor vehicles in Canada, down from the peak in 2021 but up from the level in 2017. 23,551,759 (91.7%) of these vehicles were light-duty vehicles, a category of vehicles whose gross vehicle weight rating (GVWR) does not exceed 4,535 kg. This category includes passenger cars, multi-purpose vehicles (MPVs), pickup trucks, and vans. 2.6% of registered motor vehicles were medium-duty vehicles, with a GVWR of 4,536 to 11,793 kg. This category includes box trucks and utility trucks. See the following chart. (Statistics Canada, October 2024)
- According to the 2021 Census of Population, of Canada’s approximately 13,048,500 commuters:
- 10,106,600 (77.5%) commuted by car, truck or van as the driver
- 844,200 (6.5%) commuted by car, truck or van as a passenger
- 1,811,900 (13.9%) commuted by sustainable transportation, including 1,000,500 (7.7%) who commuted by public transit and 811,400 (6.2%) by active transportation (walking or cycling)
- 285,800 (2.2%) commuted by some other method
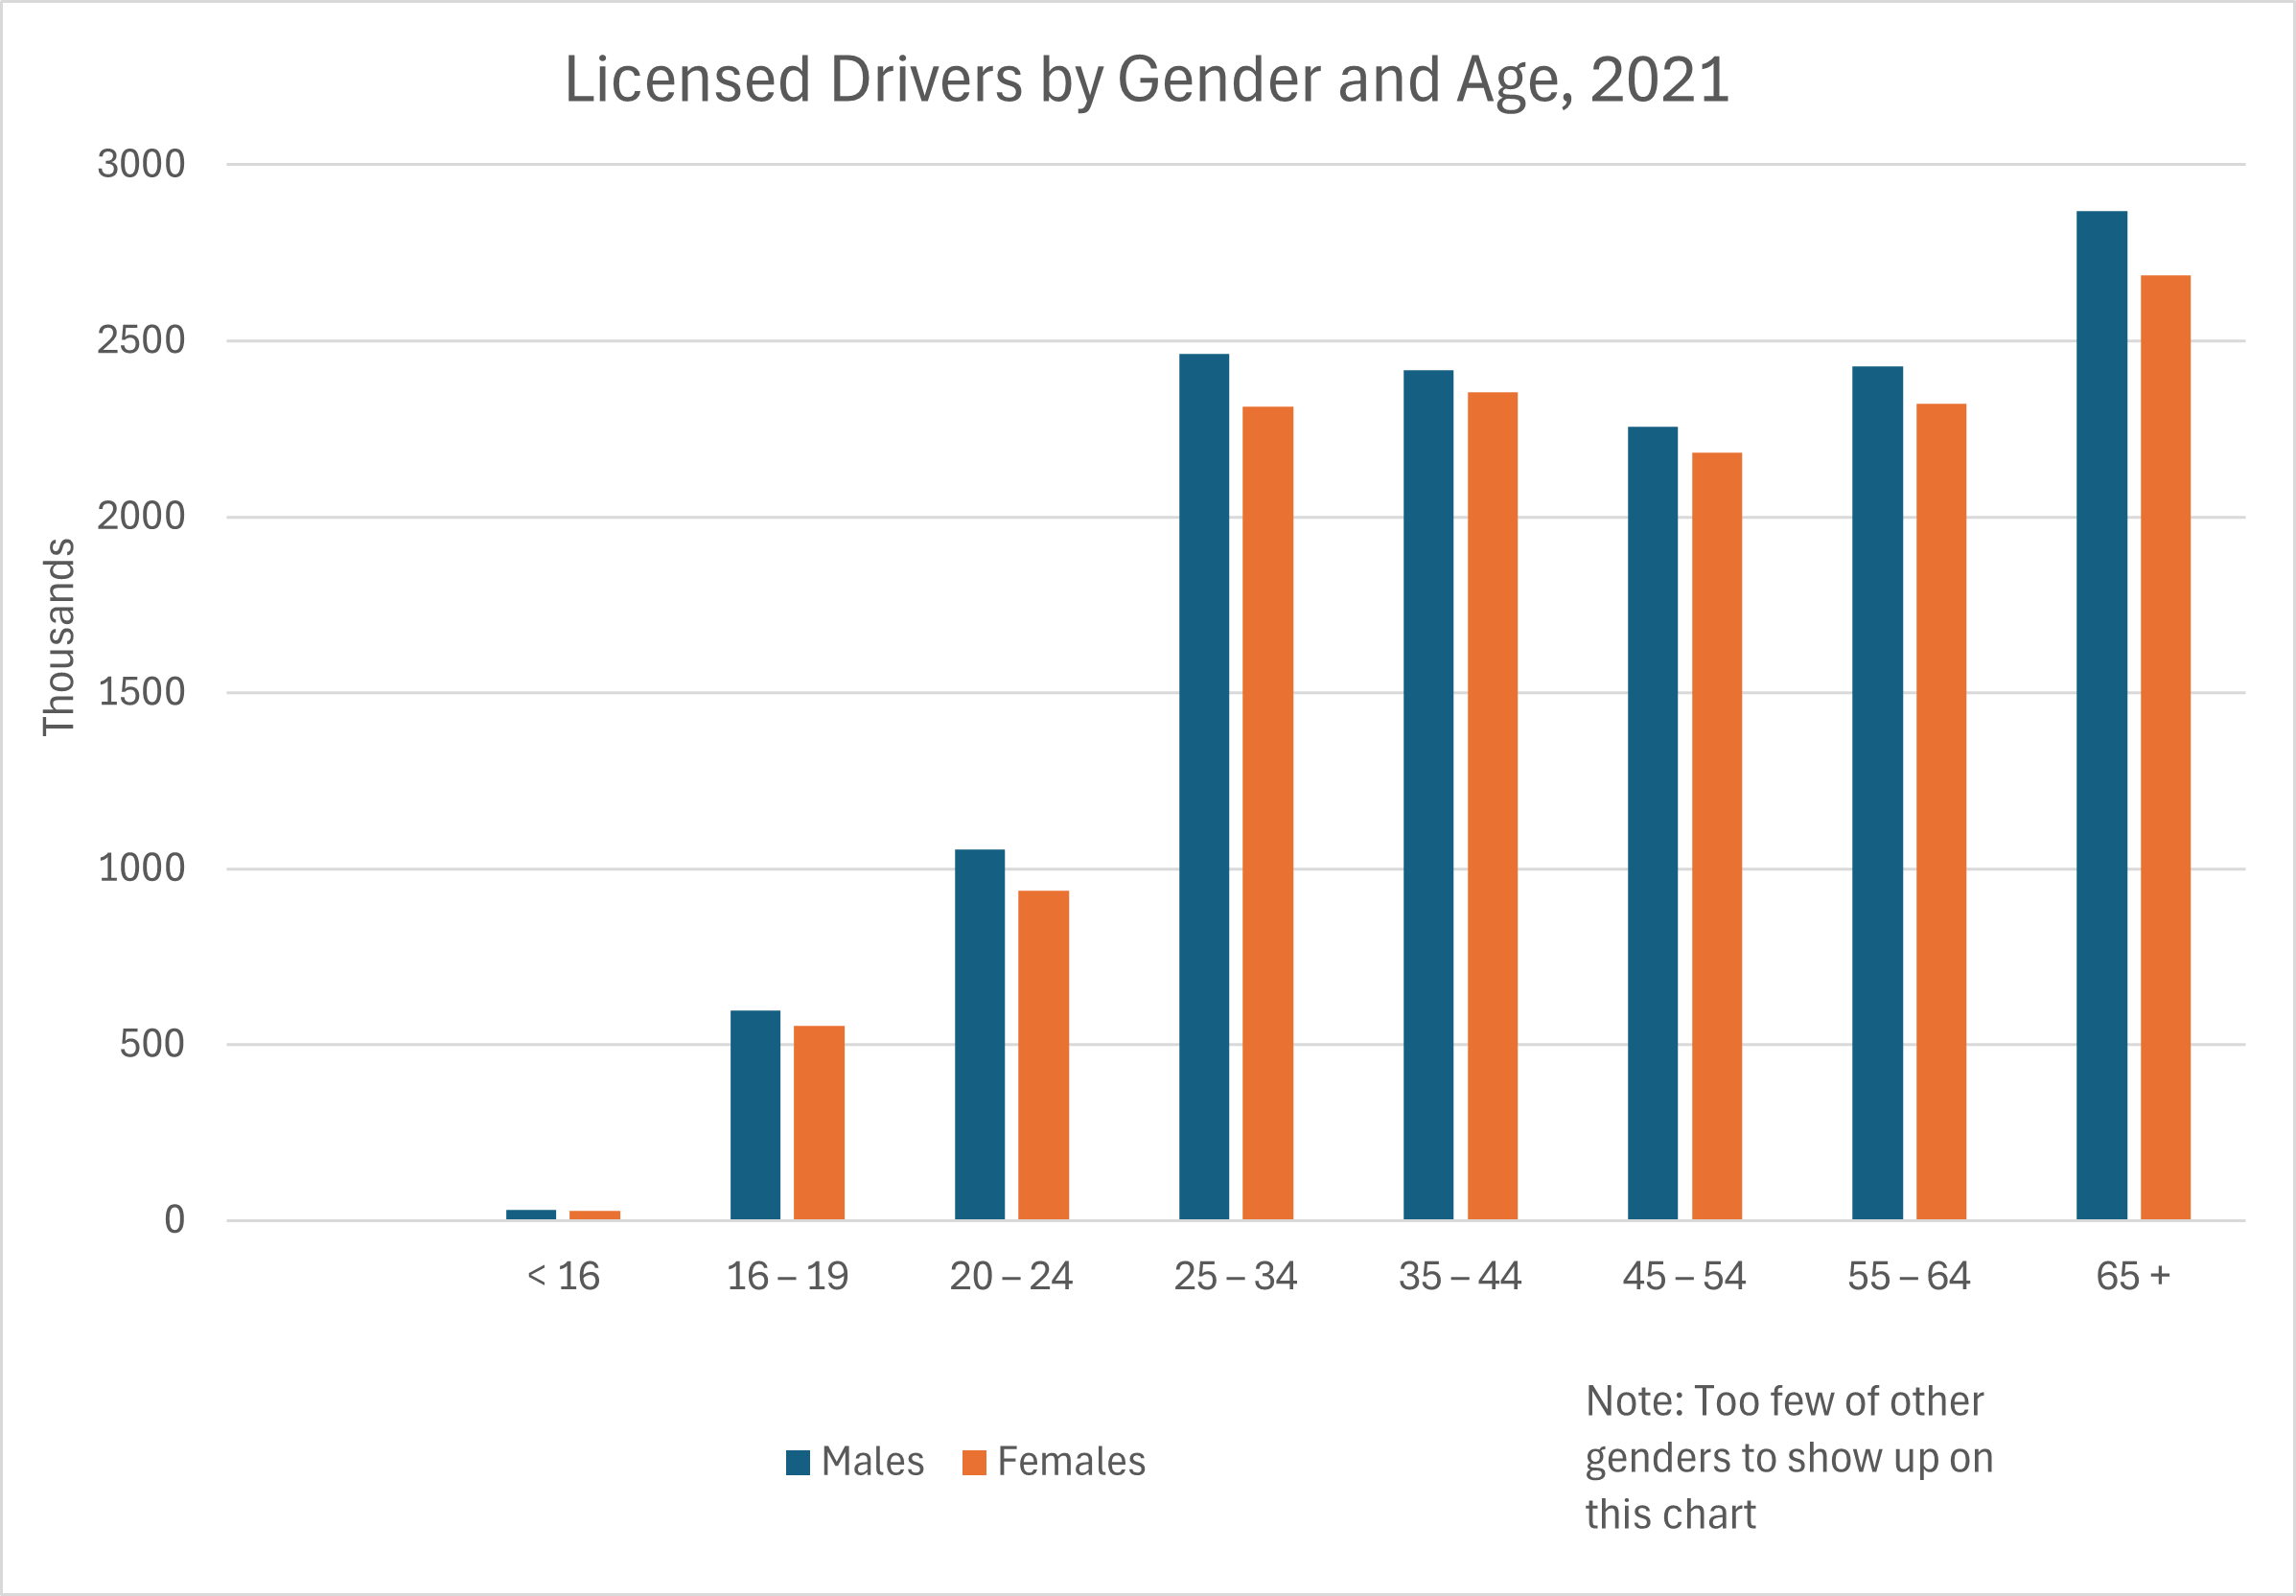
- In 2023, there were about 28,584,000 licensed drivers in Canada, up 31.9% from about 21,673,000 licensed drivers in 2004. These drivers included 14,763,000 males, 13,819,000 females, and 1,500 of other genders. (Transport Canada, May 2025)
- In 2023, the distribution of licensed drivers by gender and age was as follows: (Transport Canada, May 2025)
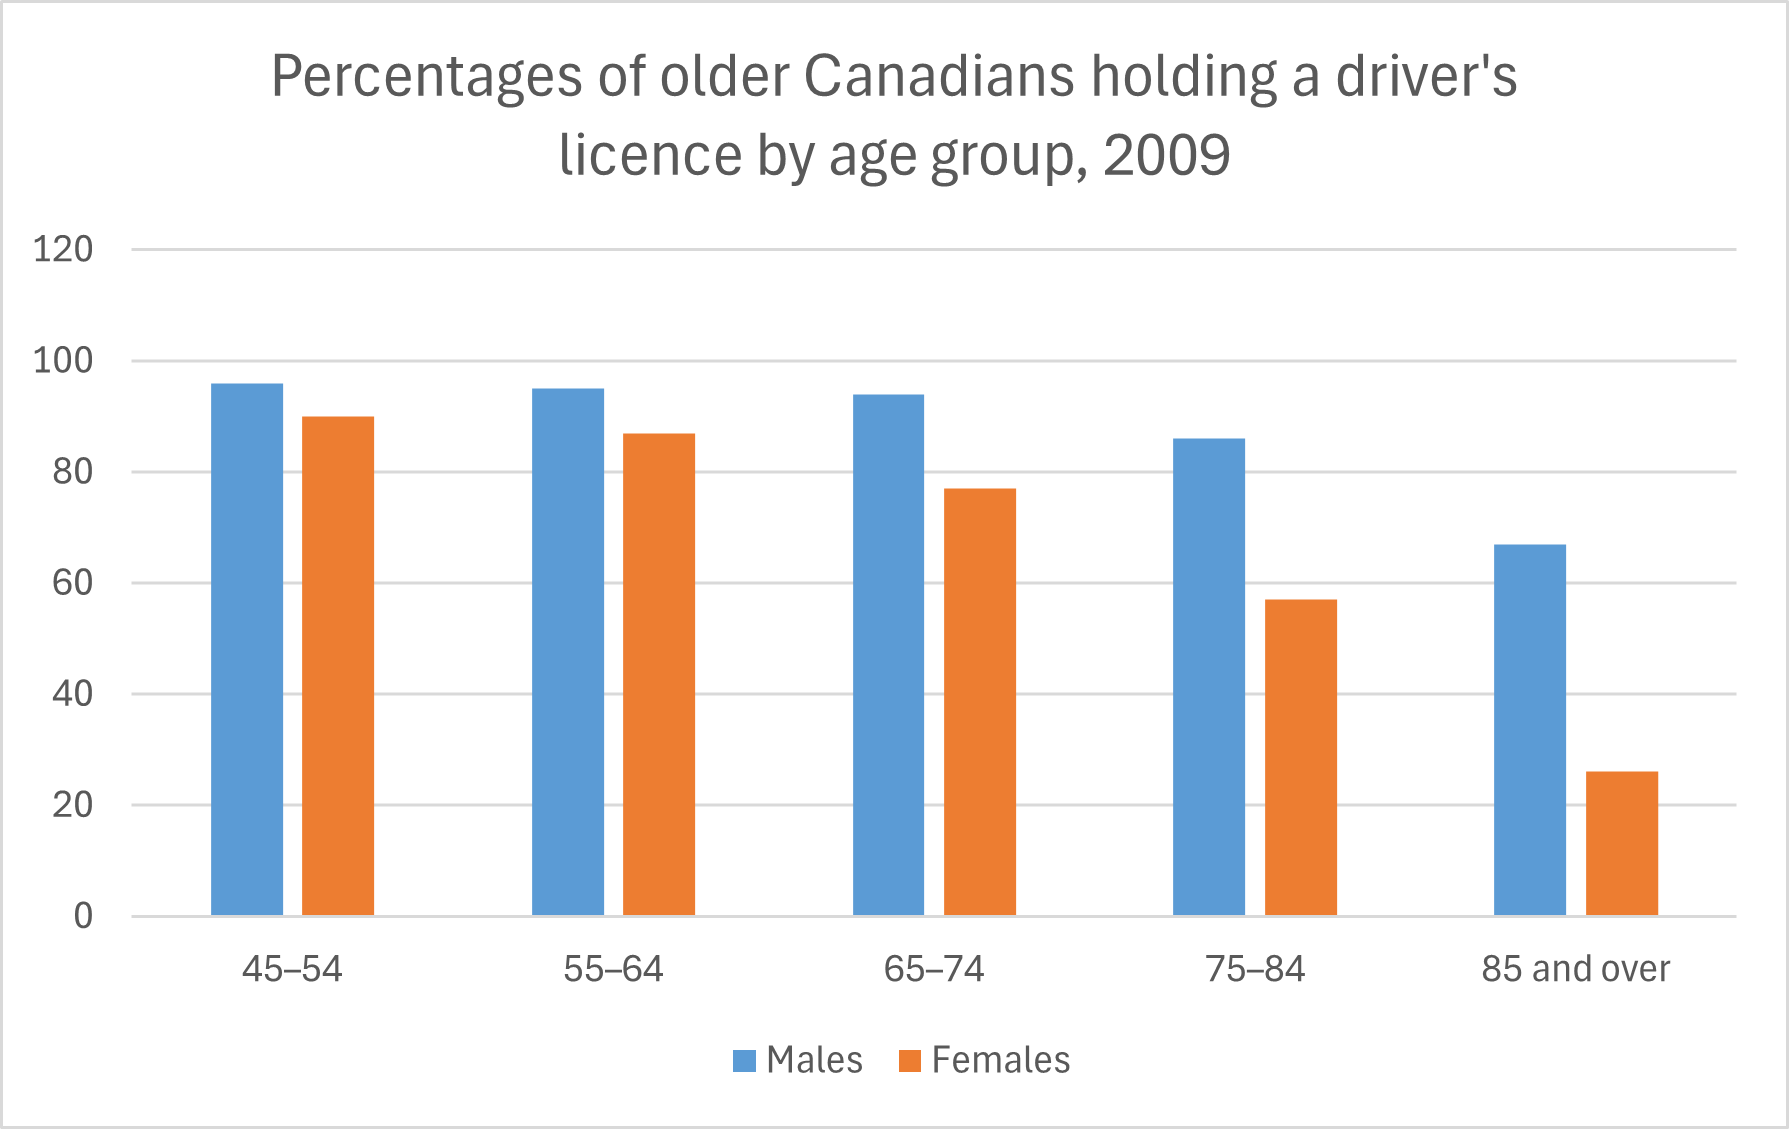
- A large survey of 42,000 Canadians aged 65 and older in 2019–2020 found that 82.0% of seniors aged 65 years and older held a valid driver’s licence, representing an estimated 5.27 million licensed drivers. 50.6% of seniors aged 85 years and older held a valid driver’s licence, representing an estimated 358,000 licensed drivers. (See the following chart for a breakdown by gender.) 76.2% of seniors aged 85 and older reported only mild or no impairment of the basic activities of daily living; only 10% reported severe or total impairment. However, 58.1% of seniors in this age group reported that their homes had adaptations to help them better cope with the activities of daily home life. (Statistics Canada, April 2022)
Some commuters employed more than one form of transportation. 87.4% of those who commuted by car, truck or van were the driver and only worker in the vehicle. (Statistics Canada, December 2022).
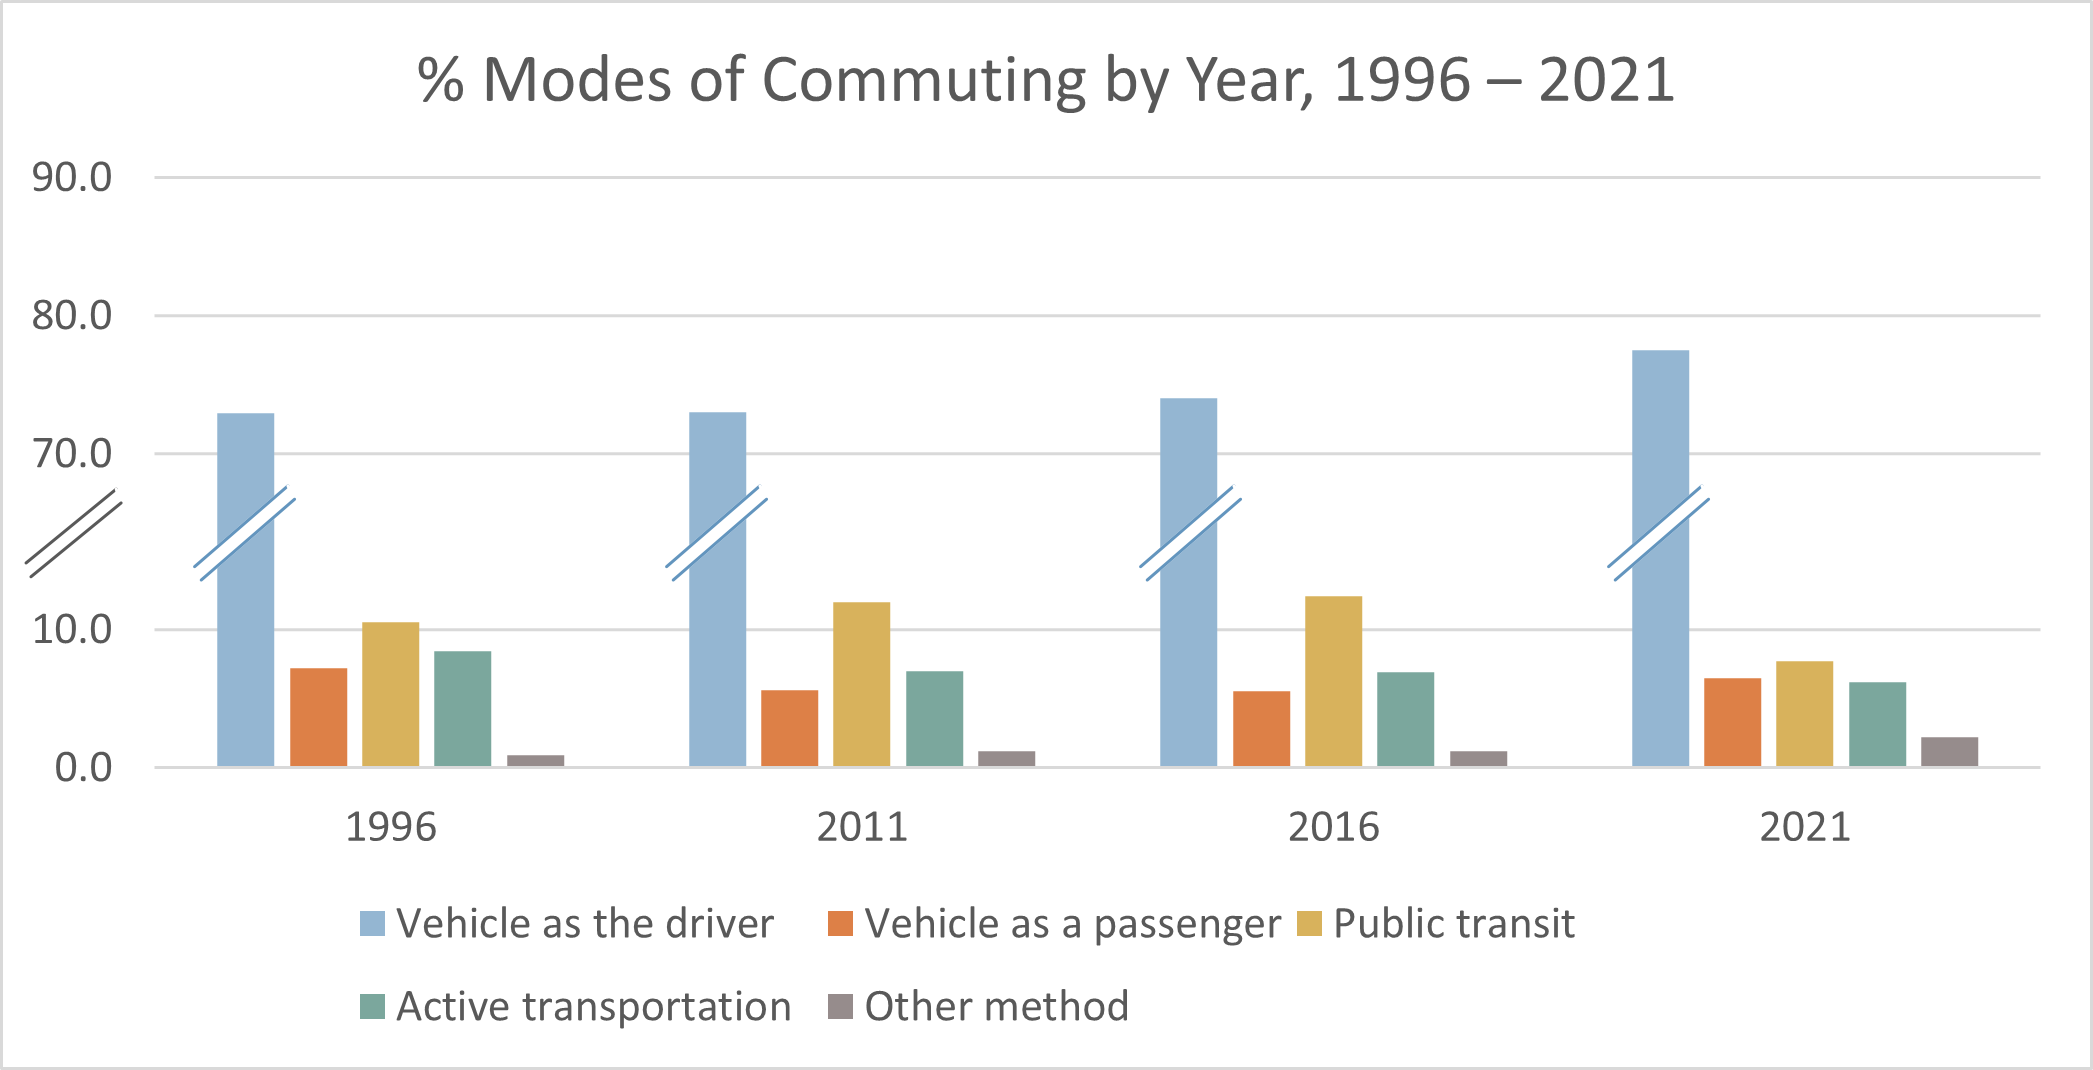
According to the official census figures, from 1996 through 2016, the share of commuters who commuted by car, truck or van declined slightly, from 80.1% in 1996 to 79.5% in 2016. The share of commuters who commuted by public transit rose from 10.5% in 1996 to 12.4% in 2016. However, in 2021, the share of commuters who commuted by public transit declined sharply to 7.7%, accompanied by a corresponding rise in commuters by car, truck or van to 84.0%, reversing prior trends. See the following chart. In the chart, “vehicle” means “car, truck or van”; motorcycles are included in “Other method.” “Active transportation” includes walking and bicycling.
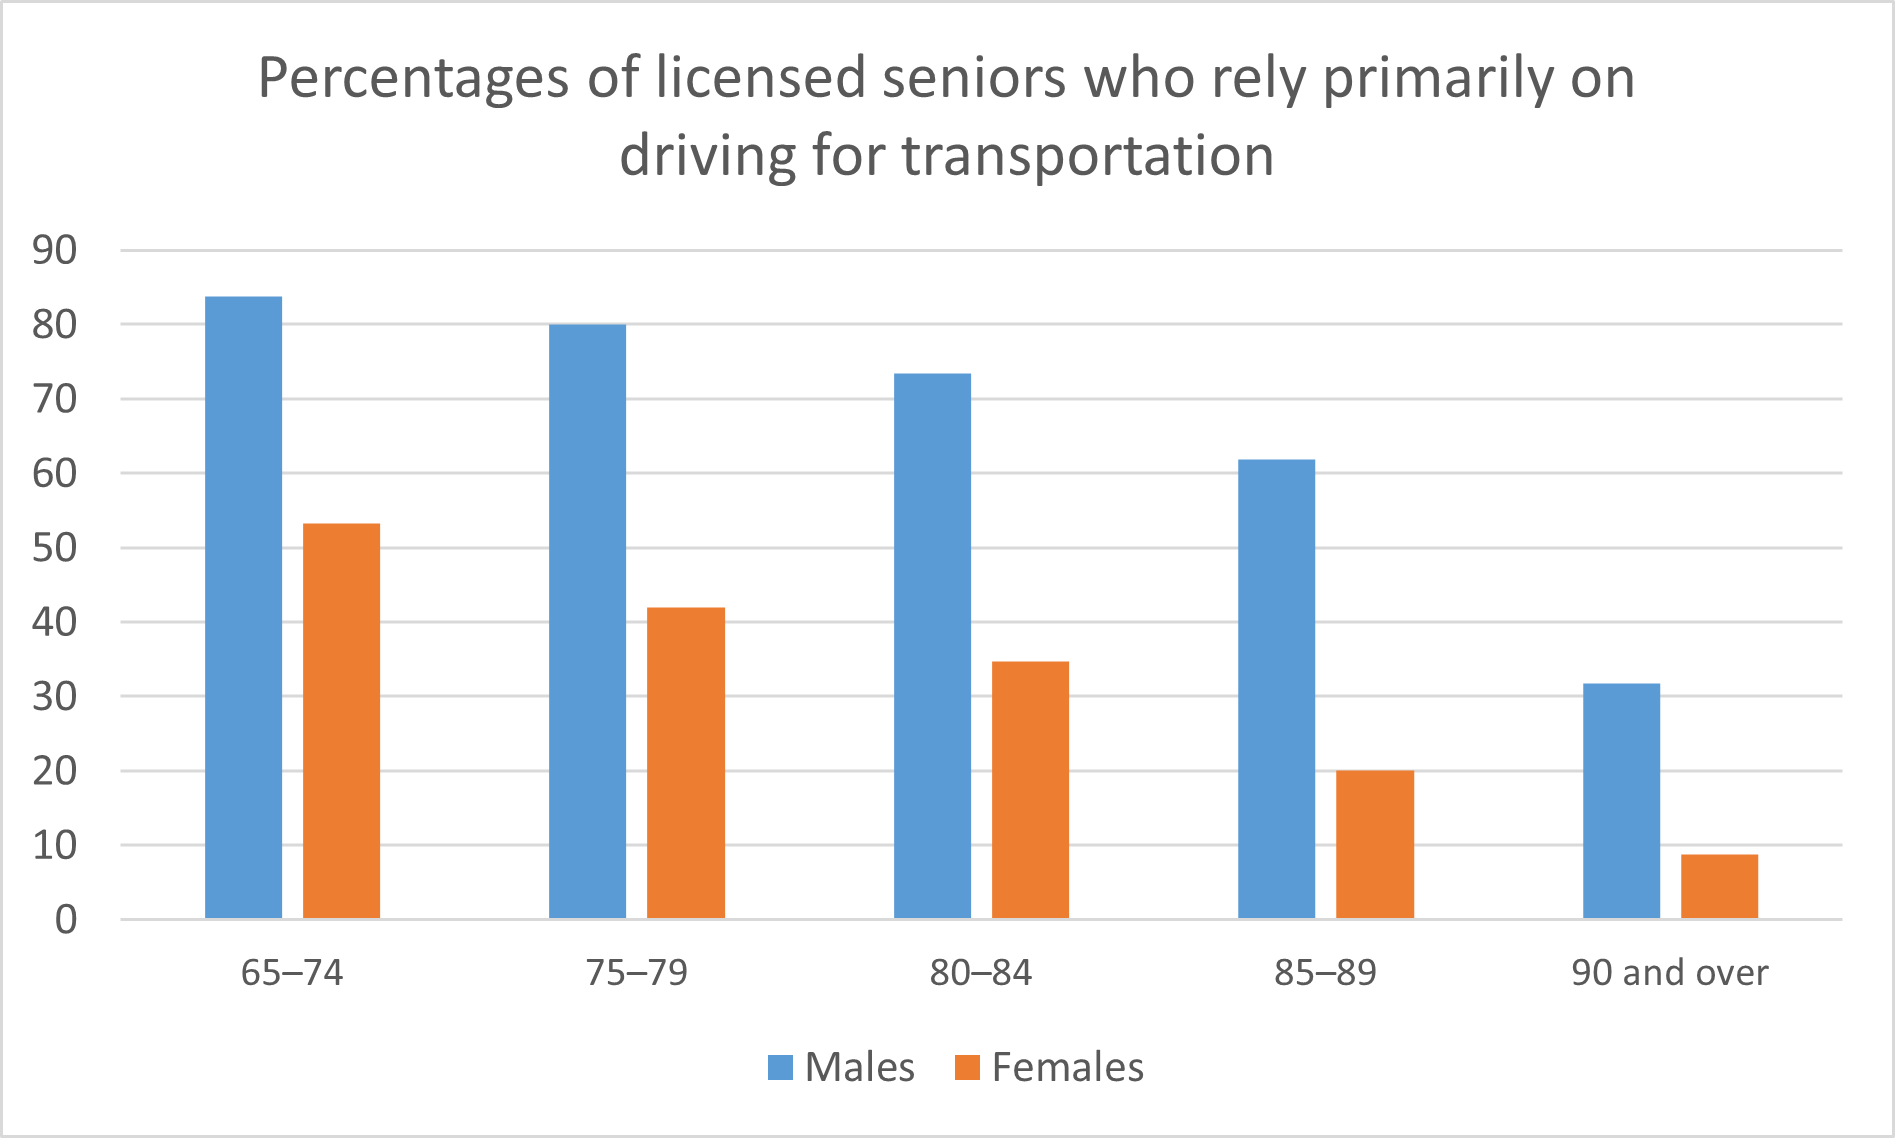
- According to a survey of Canadian senior drivers in 2009, most male drivers in their eighties continued driving regularly. See the following chart. (Statistics Canada, 2012)
- According to that same survey, about 20% of Canadian drivers aged 65 and over who had been diagnosed with Alzheimer’s disease or some form of dementia had driven a vehicle in the month preceding the survey. However, only 10% of Canadian seniors with an advanced form of their disease had a driver’s licence. (Statistics Canada, January 2012)
- In Canada, over half a million persons have been diagnosed with Alzheimer’s disease (AD). Drivers diagnosed with AD are 7.9 times as likely to have a traffic crash within five years as drivers without AD. 47% of drivers diagnosed with AD are likely to have a traffic crash within five years. (Moorhouse, Paige, et al., November 2011; Friedland, R. P., December 1988)
- A survey of Canadian drivers in March 2017 found that 26% of drivers aged 65 and older wanted to keep their licences past age 85. Factors that might persuade them to voluntarily give up their licences included advice from a medical professional (94%), concerns of family and friends (24%), and a traffic collision (14%). (State Farm Canada, August 2017)
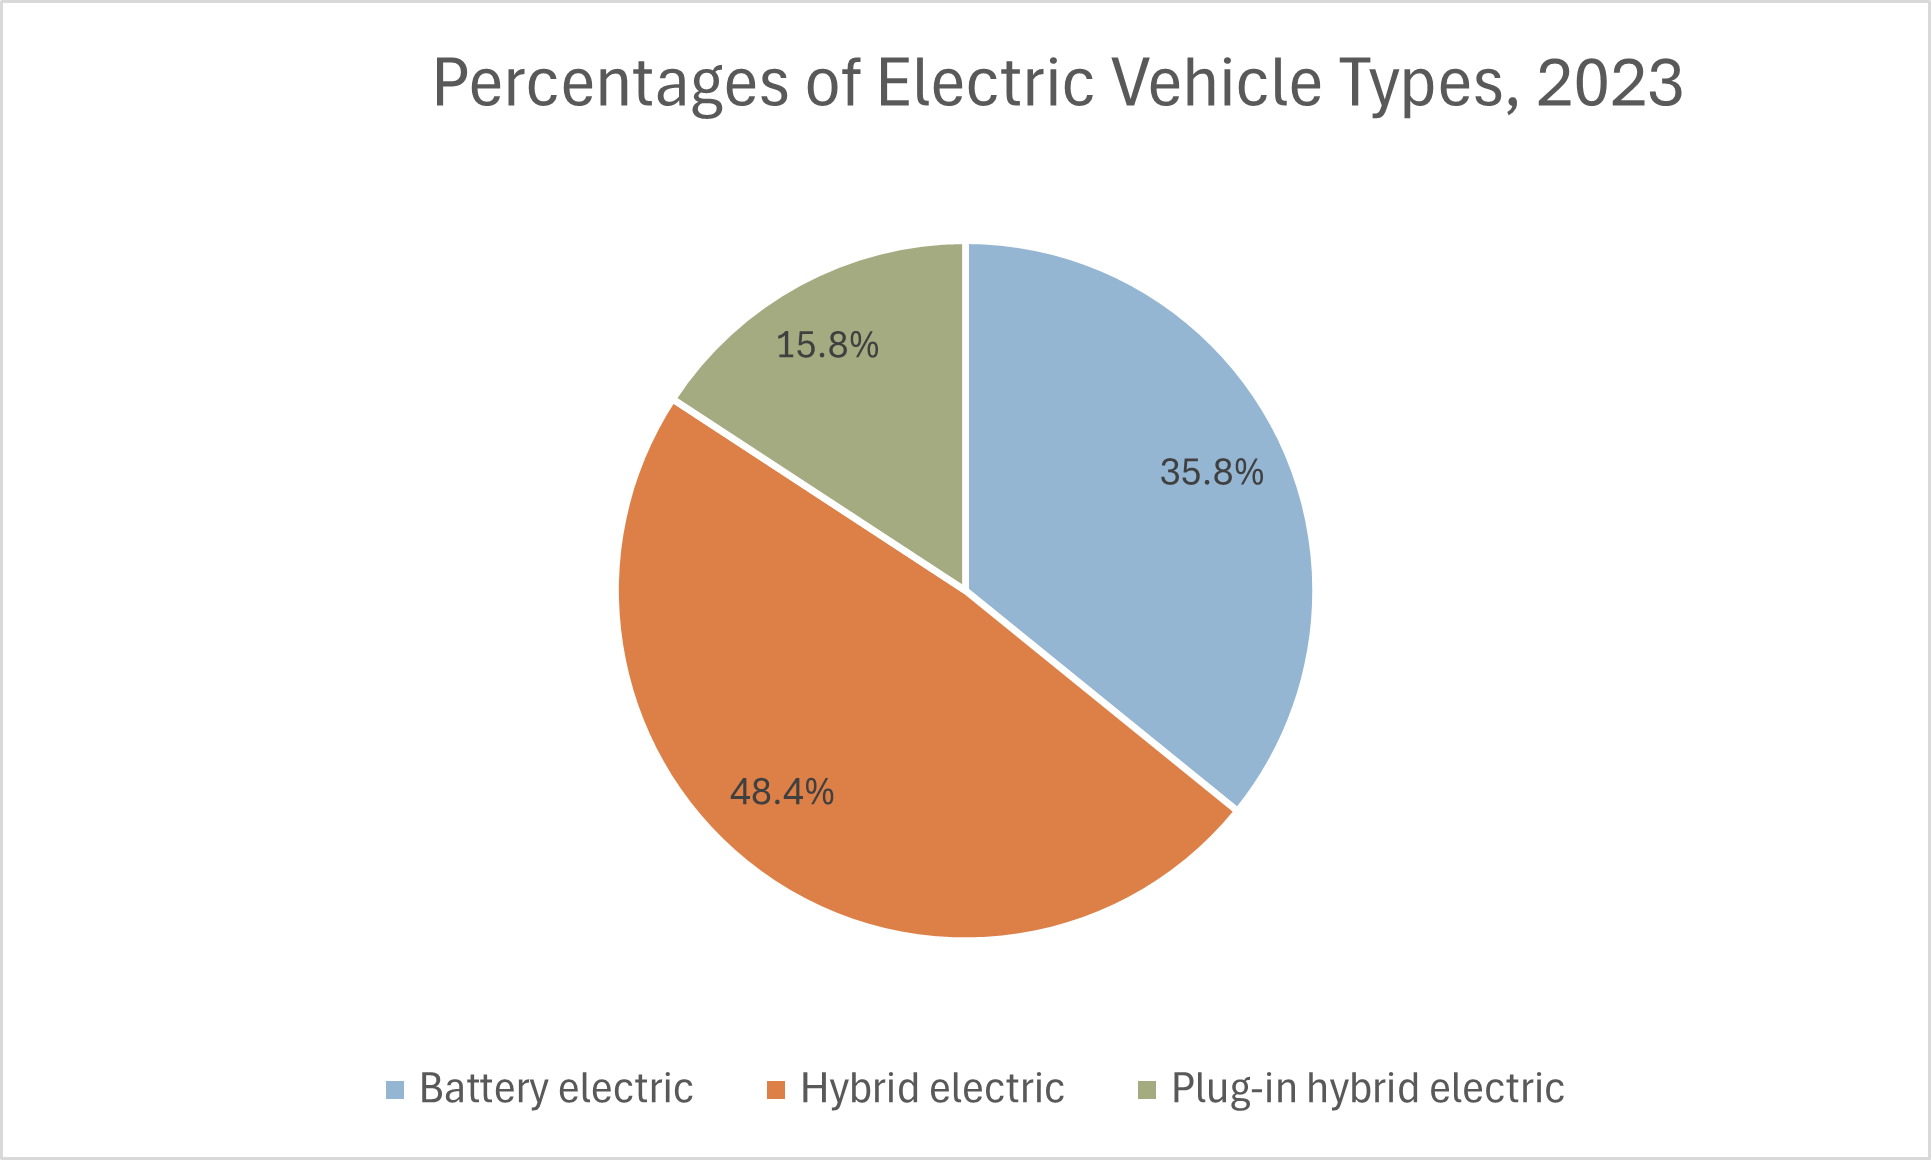
- In 2023, there were about 919,050 registered electric vehicles (EVs), making up about 3.6% of all motor vehicle registrations that year. EVs included 329,402 battery electric vehicles (BEVs), 444,630 hybrid electric vehicles (HEVs), and 145,018 plug-in hybrid electric vehicles (PHEVs). (HEVs have a gasoline engine, which keeps the batteries charged. PHEVs also have a gasoline engine, but the batteries are charged by an external electric power source. BEVs have no gasoline engine; the batteries are charged by an external power source.) (Statistics Canada, November 2023)
- In 2023, EV registrations were up 325.6% from 2017, when there were 215,962 registered EVs, making up just 0.9% of all vehicle registrations in that year. In 2023, 48.4% of registered EVs were HEVs, 35.8% were BEVs, and 15.8% were PHEVs. (See the following chart.) In 2017, 79.7% of registered EVs were HEVs, only 9.2% were BEVs, and 11.0% were PHEVs. (Statistics Canada, November 2023)
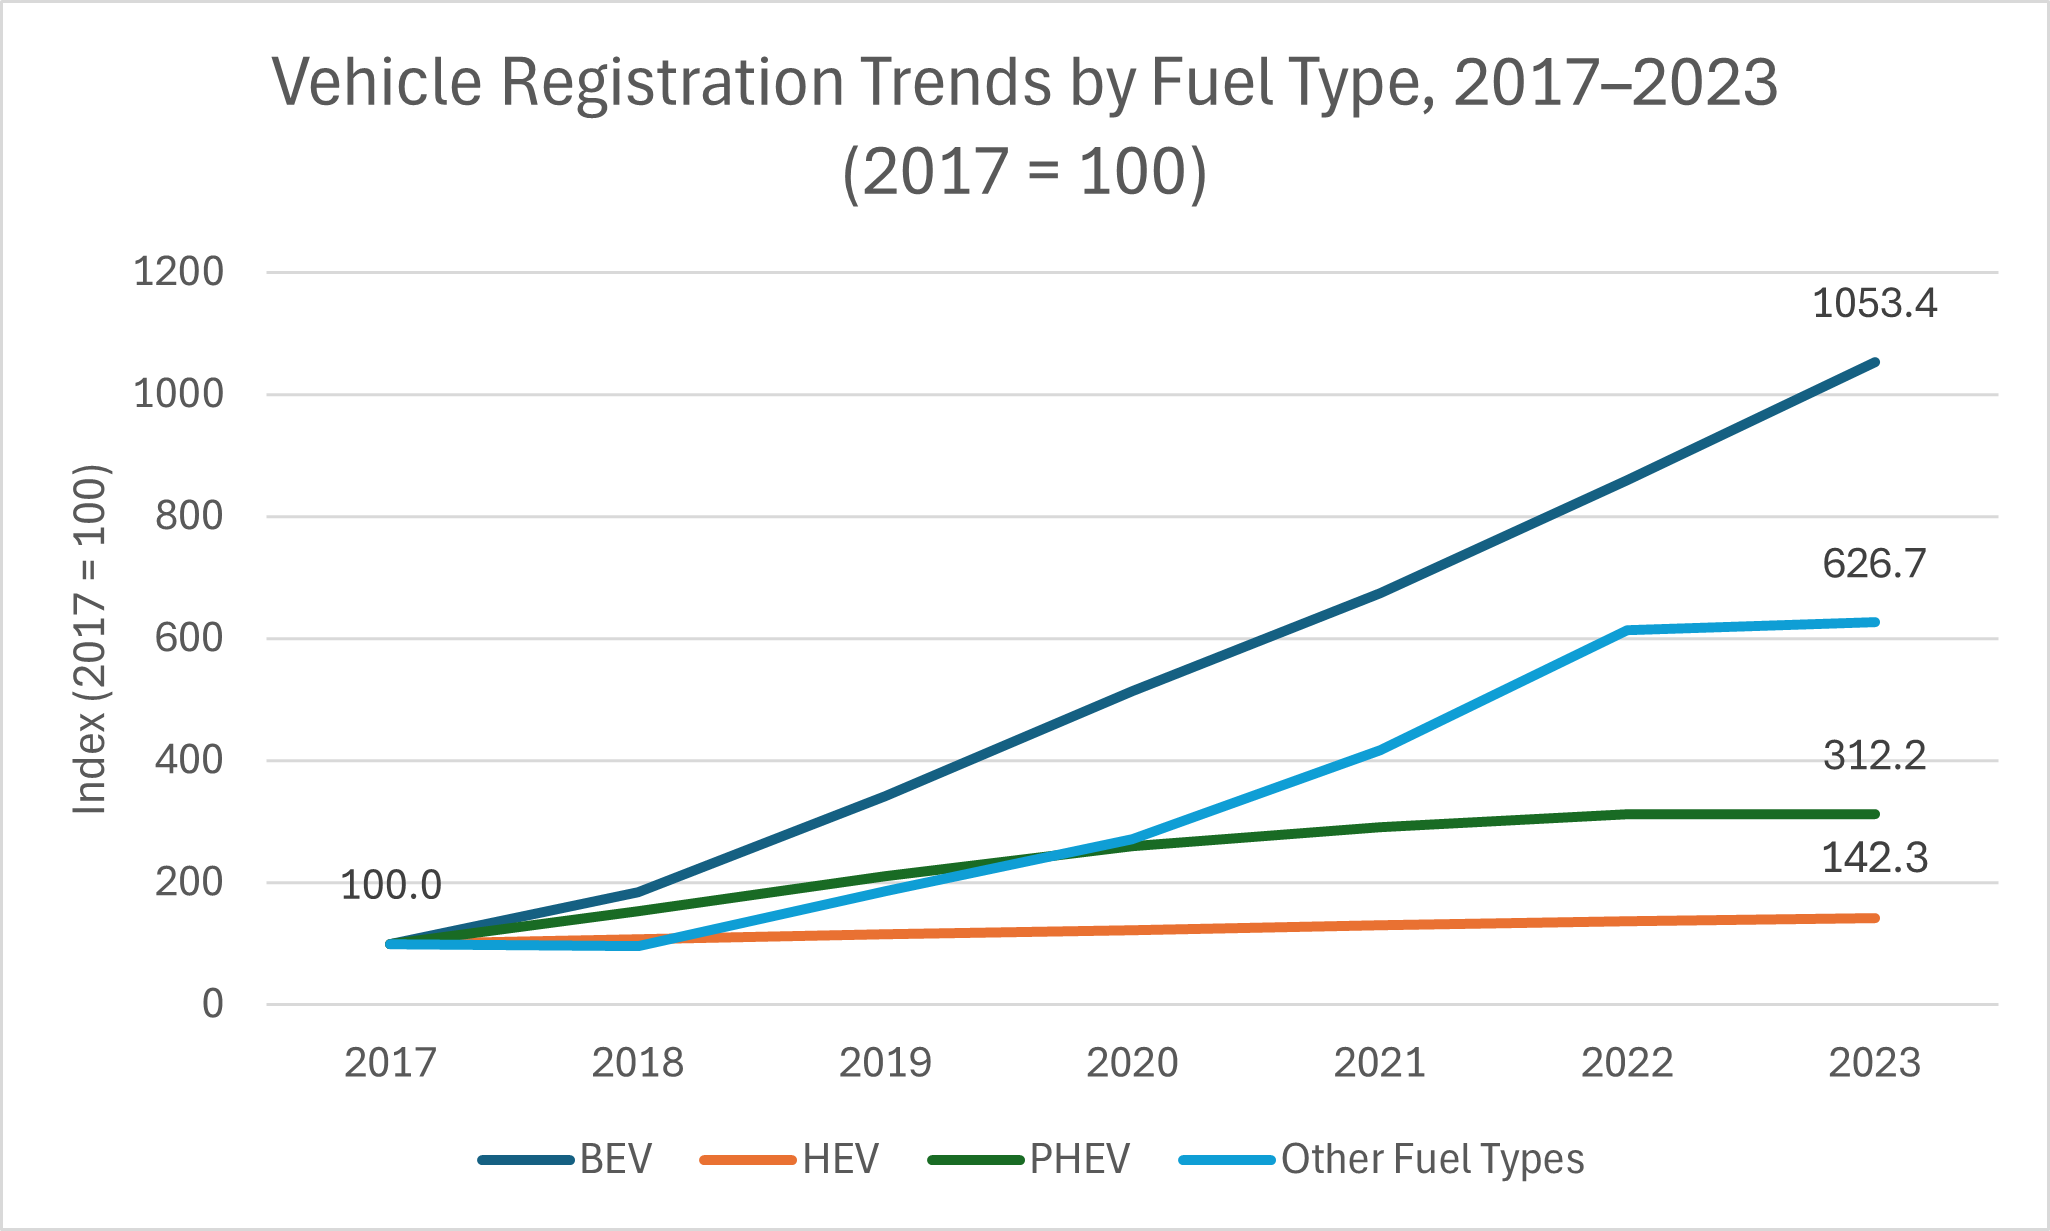
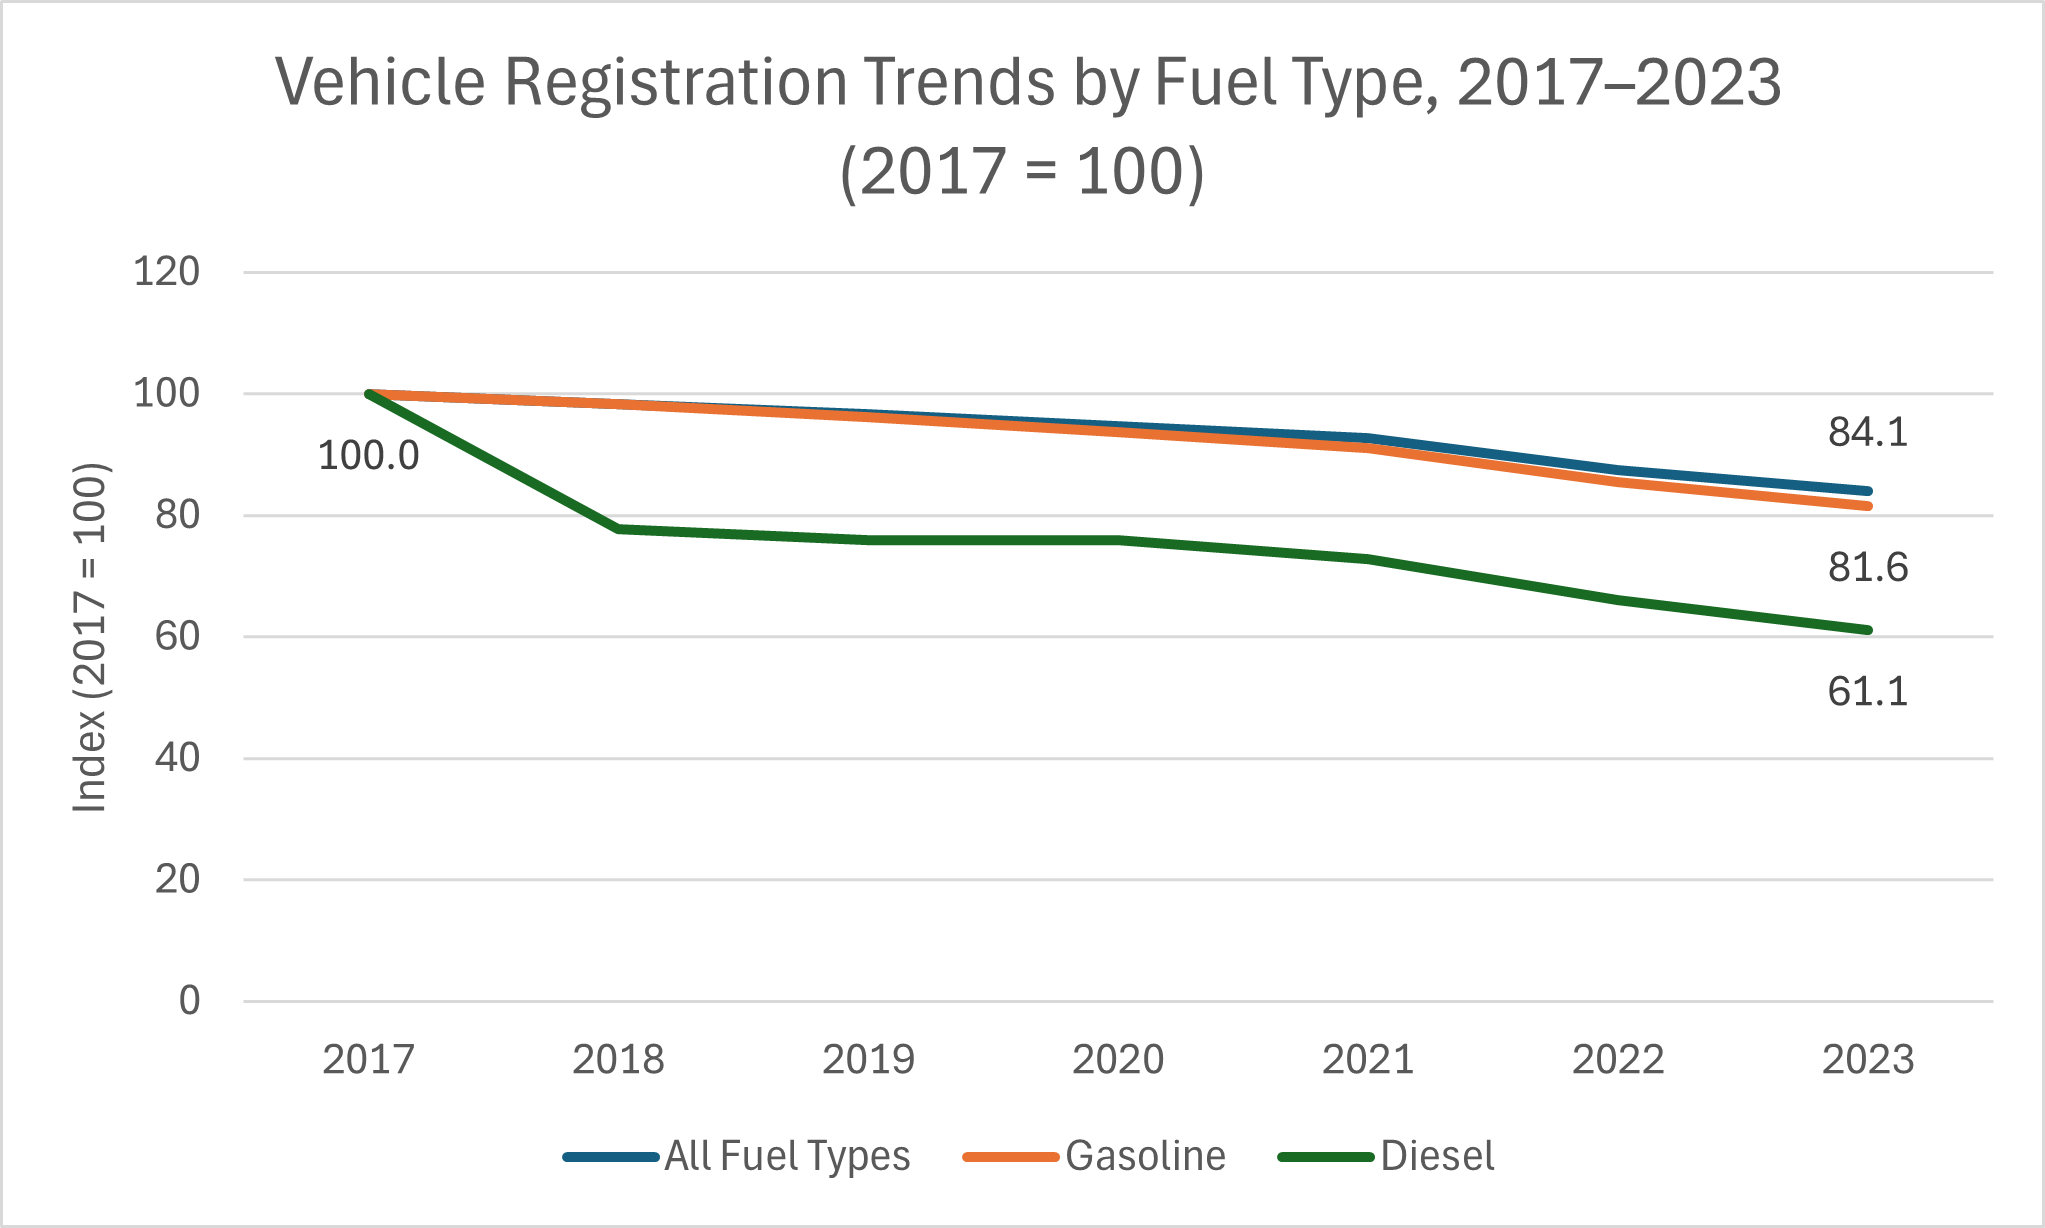
- From 2017 to 2023, registrations of passenger cars (all types of fuels) declined by 15.9%, mostly because of an 18.4% decline in gasoline-powered car registrations. On the other hand, registrations of all types of electric vehicles (EVs) as passenger cars had increased since 2017. Registrations of HEVs had risen by 42.3%, registrations of PHEVs had risen by 212.2%, and registrations of BEVs had risen by a remarkable 953.4%. See the following two charts. (Statistics Canada, October 2024)
- In 2023, light-duty (4,536 kg or less) vehicles accounted for 91.7% of all registered vehicles, medium-duty (4,536 to 11,793 kg) vehicles accounted for 2.7% of registered vehicles, heavy-duty (11,794 kg or greater) vehicles accounted for 2.21%, buses accounted for 0.3%, and motorcycles and mopeds accounted for 3.2%. (Statistics Canada, October 2024)
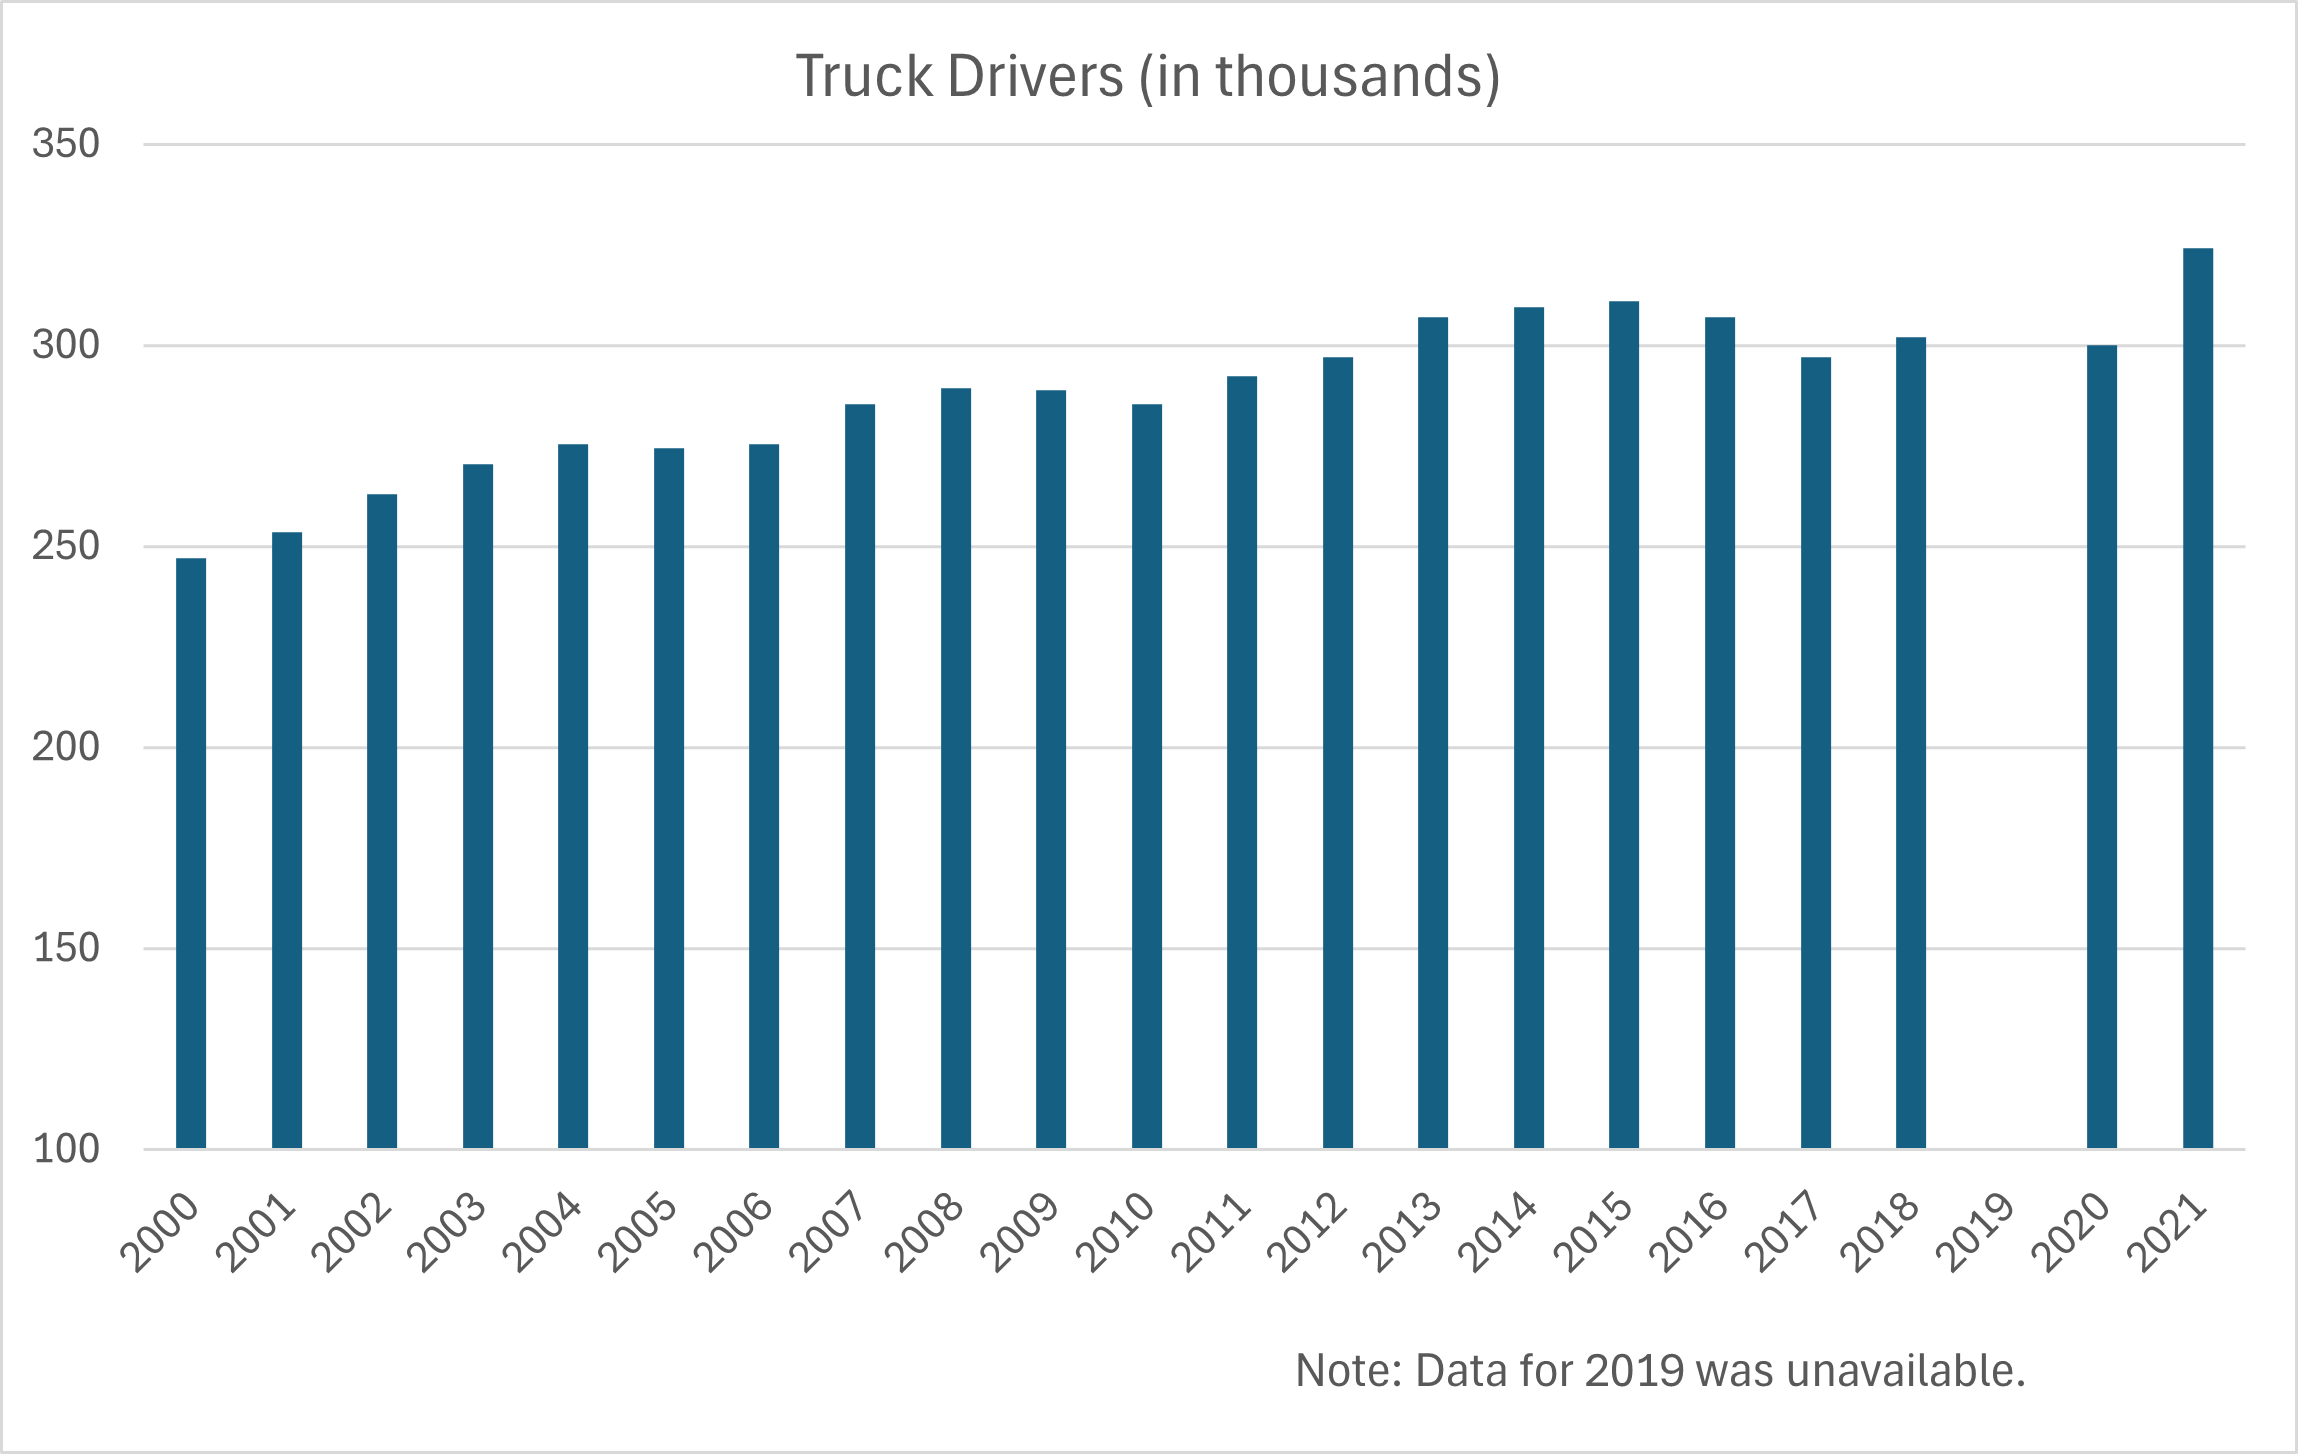
- From 2000 to 2021, the number of truck drivers in Canada’s trucking industry increased by 31.3%, from about 247,000 in 2000 to about 324,200 in 2021. There was a relatively sharp one-year increase of 8.1% in 2021. See the following chart. (Statista, December 2023)
- During the period 2013–2022, an average of 316,130 Canadians were employed per year as truck drivers, making truck driving one of the top occupations in the country. Transport truck drivers make up 43% of the persons employed in the trucking and logistics sector. (Statista, December 2023; Trucking HR Canada, March 2024)
- The Canadian trucker workforce is aging. In 2021, the average age of a Canadian truck driver was 49, up from 44 years of age in 2016. Only 3.4% of truck drivers were 24 years of age or younger, down from 4.6% in 2016. 35% of truck drivers were 55 years of age or older, up from 28% in 2016. (PwC Canada, 2023)
- In 2022, there were about 720,000 licensed motorcyclists in Canada, riding 852,300 on-road motorcycles and 283,400 off-road motorcycles. (Moto Canada, October 2023)
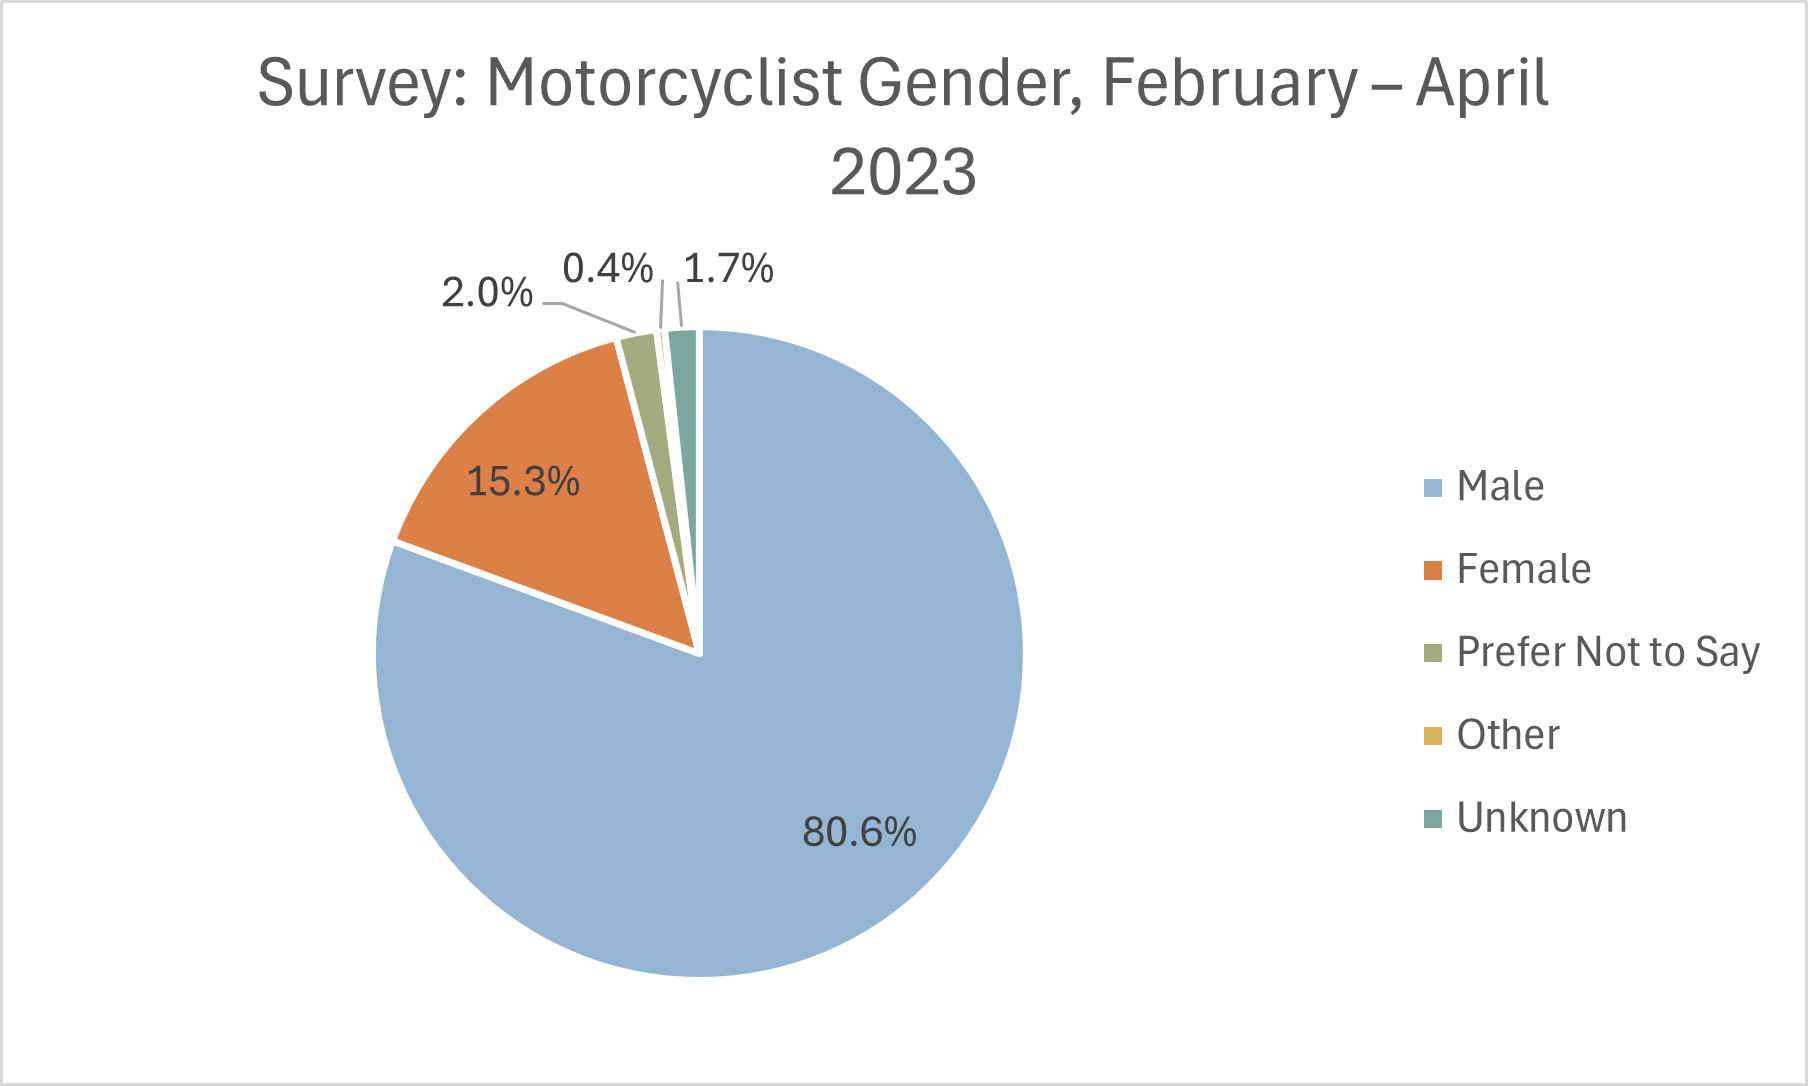
- A survey of 7,063 motorcyclists from February 2023 to April 2023 found that 80.6% were male. See the following chart. (Moto Canada, October 2023)
- In an online survey of 1,450 Canadian drivers during July 2017, 95% of respondents said they considered themselves good drivers. However, 93% of respondents admitted to certain distracting behaviours when behind the wheel, such as drinking coffee or water (80%), changing the radio station or adjusting the volume (79%), or eating while behind the wheel (59%). More distracting behaviours included combing one’s hair or putting on makeup (9%) and flossing (3%). Additionally, 19% of respondents admitted to driving under the influence. (belairdirect, accessed May 2025)
- In a poll of 2,503 Canadians during October 2023, 88% of respondents said they were deeply worried about speeding in residential neighborhoods. However, 22% of the respondents admitted to doing it themselves. The following chart lists the most common dangerous driving behaviours that respondents admitted to doing. (Cision Canada, January 2024)
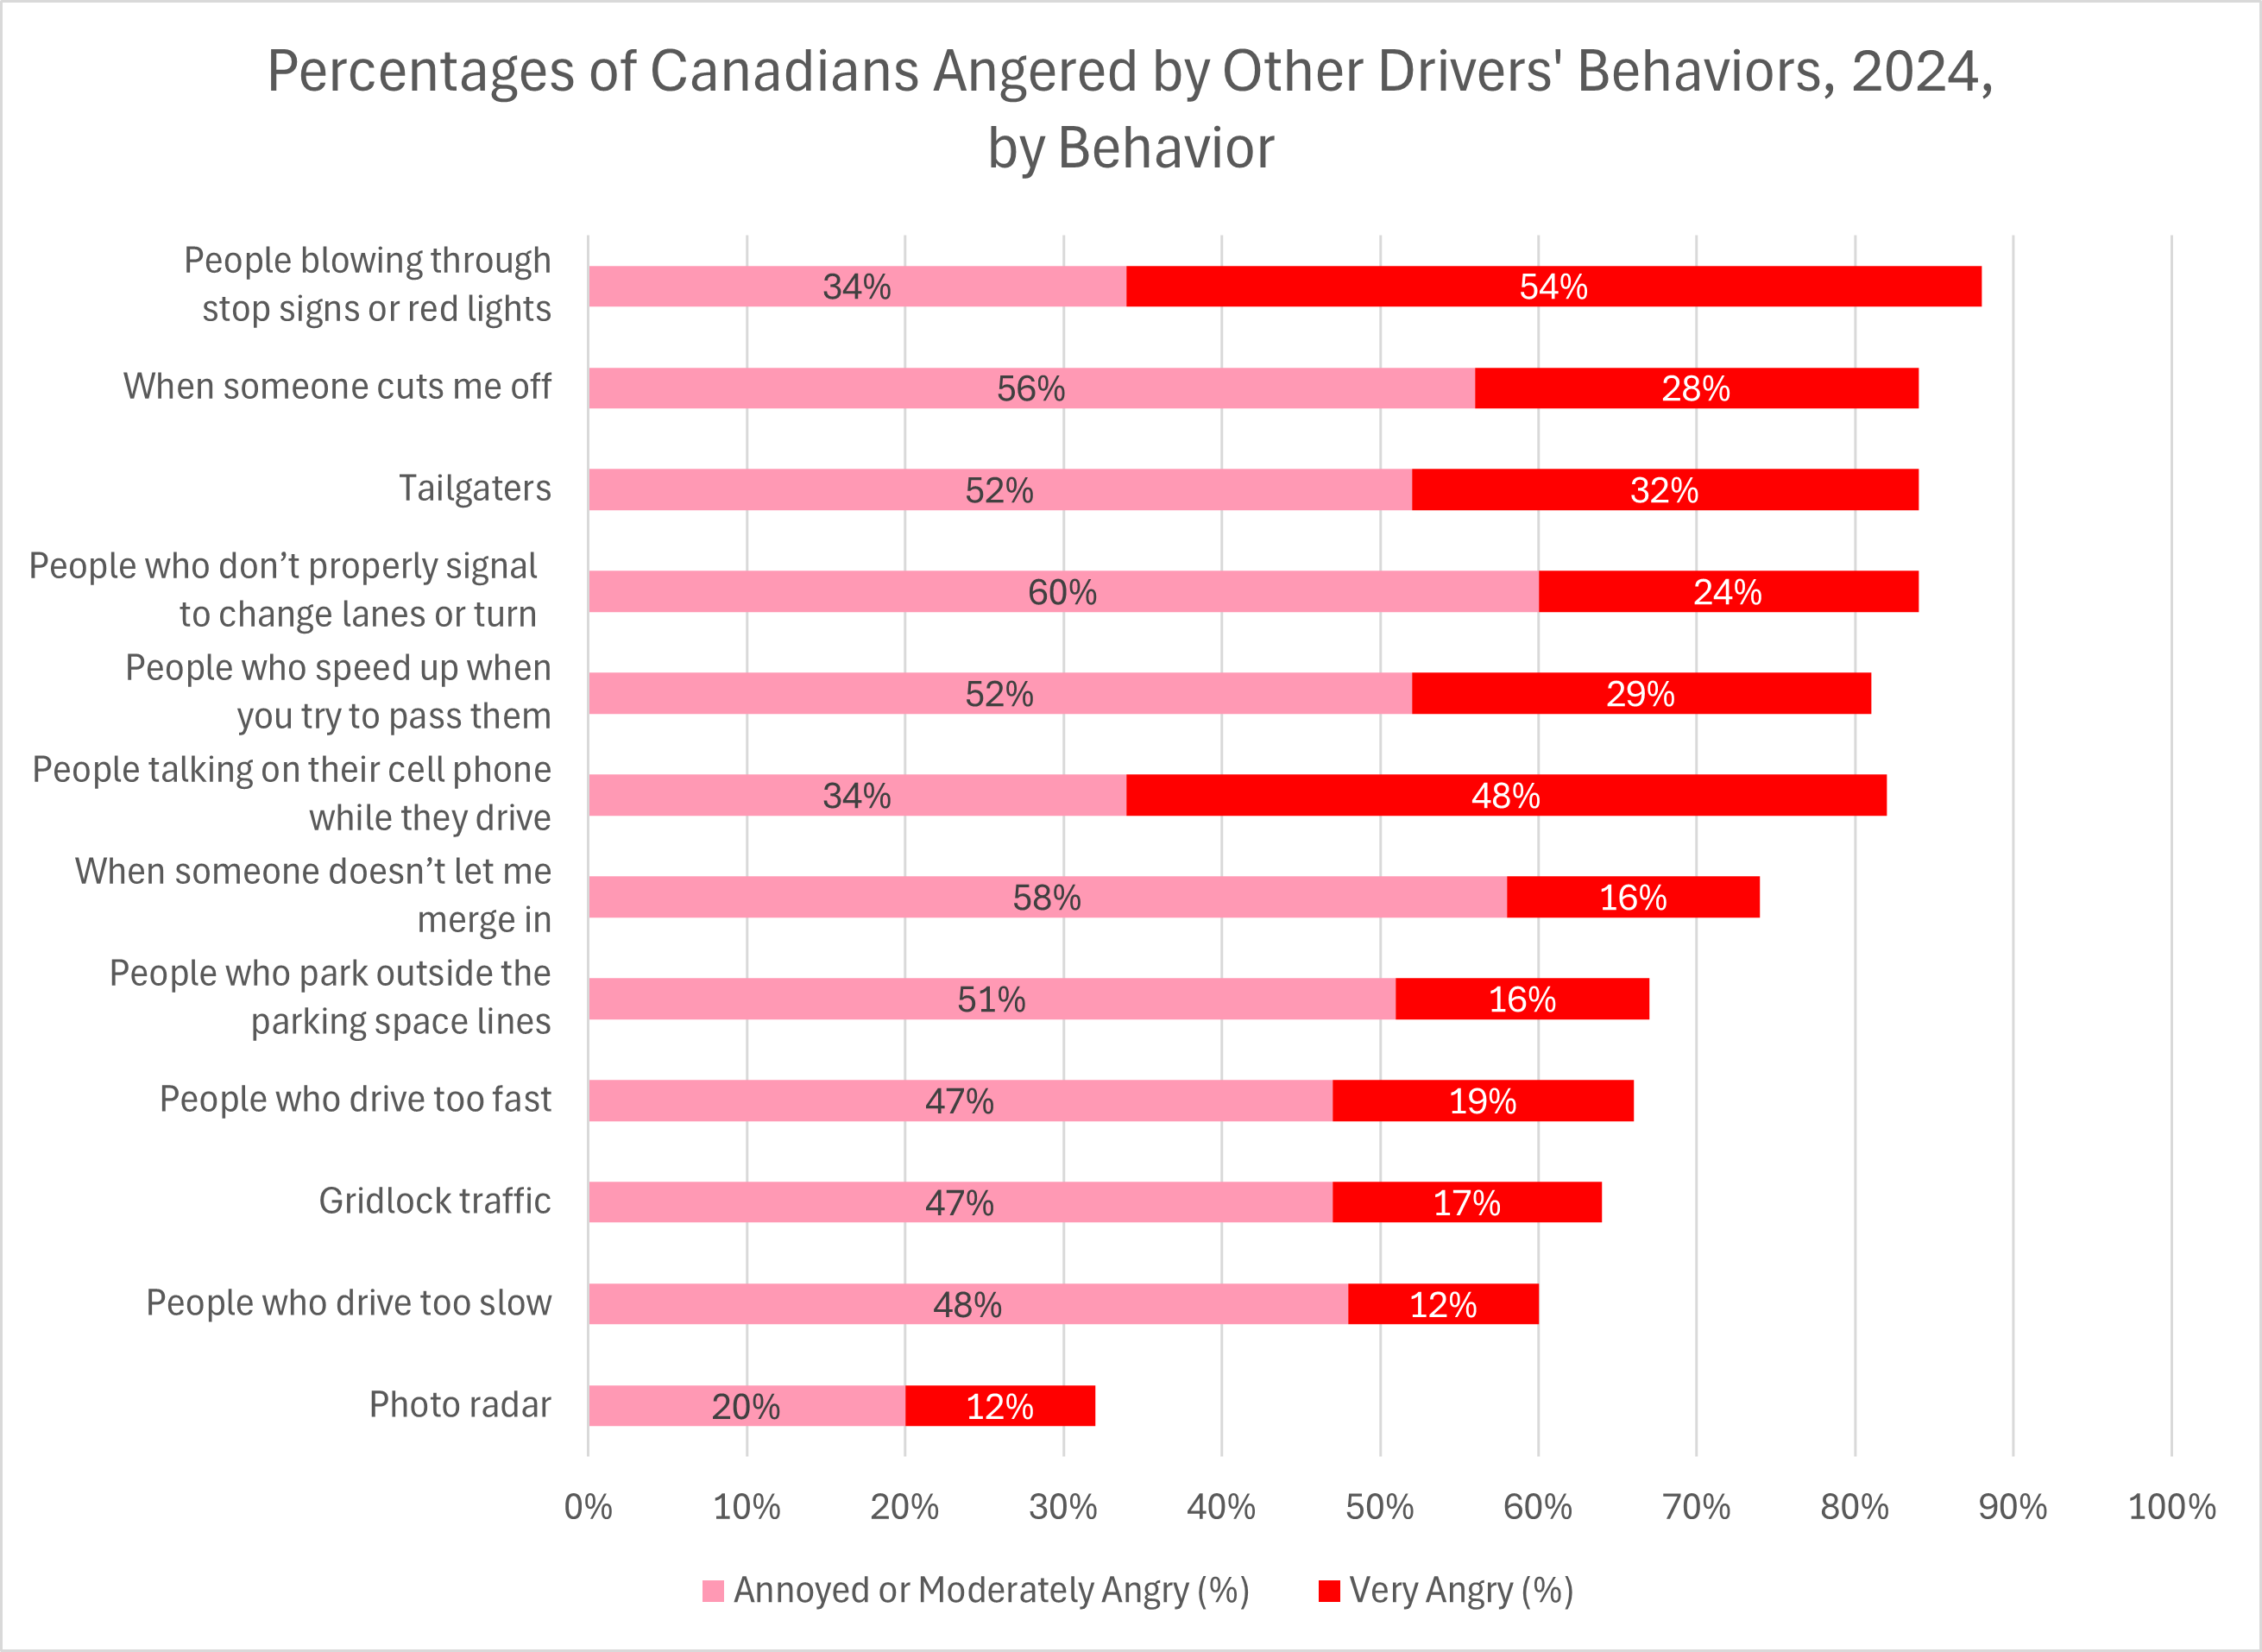
- A survey in January 2024 examined various factors that might contribute to road rage. Of the 1,510 adult respondents surveyed, overwhelming majorities stated that they were annoyed or angered by drivers blowing through red lights or stop signs, drivers cutting them off, tailgaters, drivers who failed to signal before turning or changing lanes, drivers who deliberately sped up to block you from passing them, and drivers who talked on cell phones while driving. Drivers blowing through red lights or stop signs made most respondents “very” angry. See the following chart. (Pollara Strategic Insights, February 2024)
- In a survey of 1,000 Canadian drivers aged 18–69 from January 29 through February 2, 2024, 46% of respondents stated that the nation’s roads had become less safe over the past year. Still, most respondents admitted to engaging in various distractions while driving, such as reading directions or maps (72%), eating or drinking (80%), reading text messages or emails (22%), and typing text messages or emails (14%). 31% of respondents admitted to making work-related calls, emails, or text messages while behind the wheel. 76% of whose who engaged in such work-related communication said they believed it was required of their job. Finally, 43% of the 1,000 respondents admitted to driving while tired. (HUB SmartCoverage, July 2024)
- In a survey of 4,984 Canadian drivers aged 16–64 in January 2025, 66% of respondents aged 18–24 said they would plan in advance how to get home when they know they’ll be drinking alcohol. 80% of these young respondents reported that taxi service was readily available. 73% of these young respondents cited being under the influence of alcohol and drugs as a major factor contributing to serious accidents. Unfortunately, 40% of these young respondents believed that alcohol and drug consumption had increased in the previous five years. (belairdirect, accessed May 2025)
- Also see the section Distracted Driving Statistics.
Speeding
- In 2023, speeding (exceeding the speed limit or driving too fast for the conditions) was a contributing factor in 24.8% of fatal collisions, more than any other individual contributing factor (even driving impaired). (Transport Canada, May 2025)
- In the United States, more than one-third of motorcycle riders involved in fatal crashes had exceeded the speed limit at the time. (Carsurance.net, April 2022)
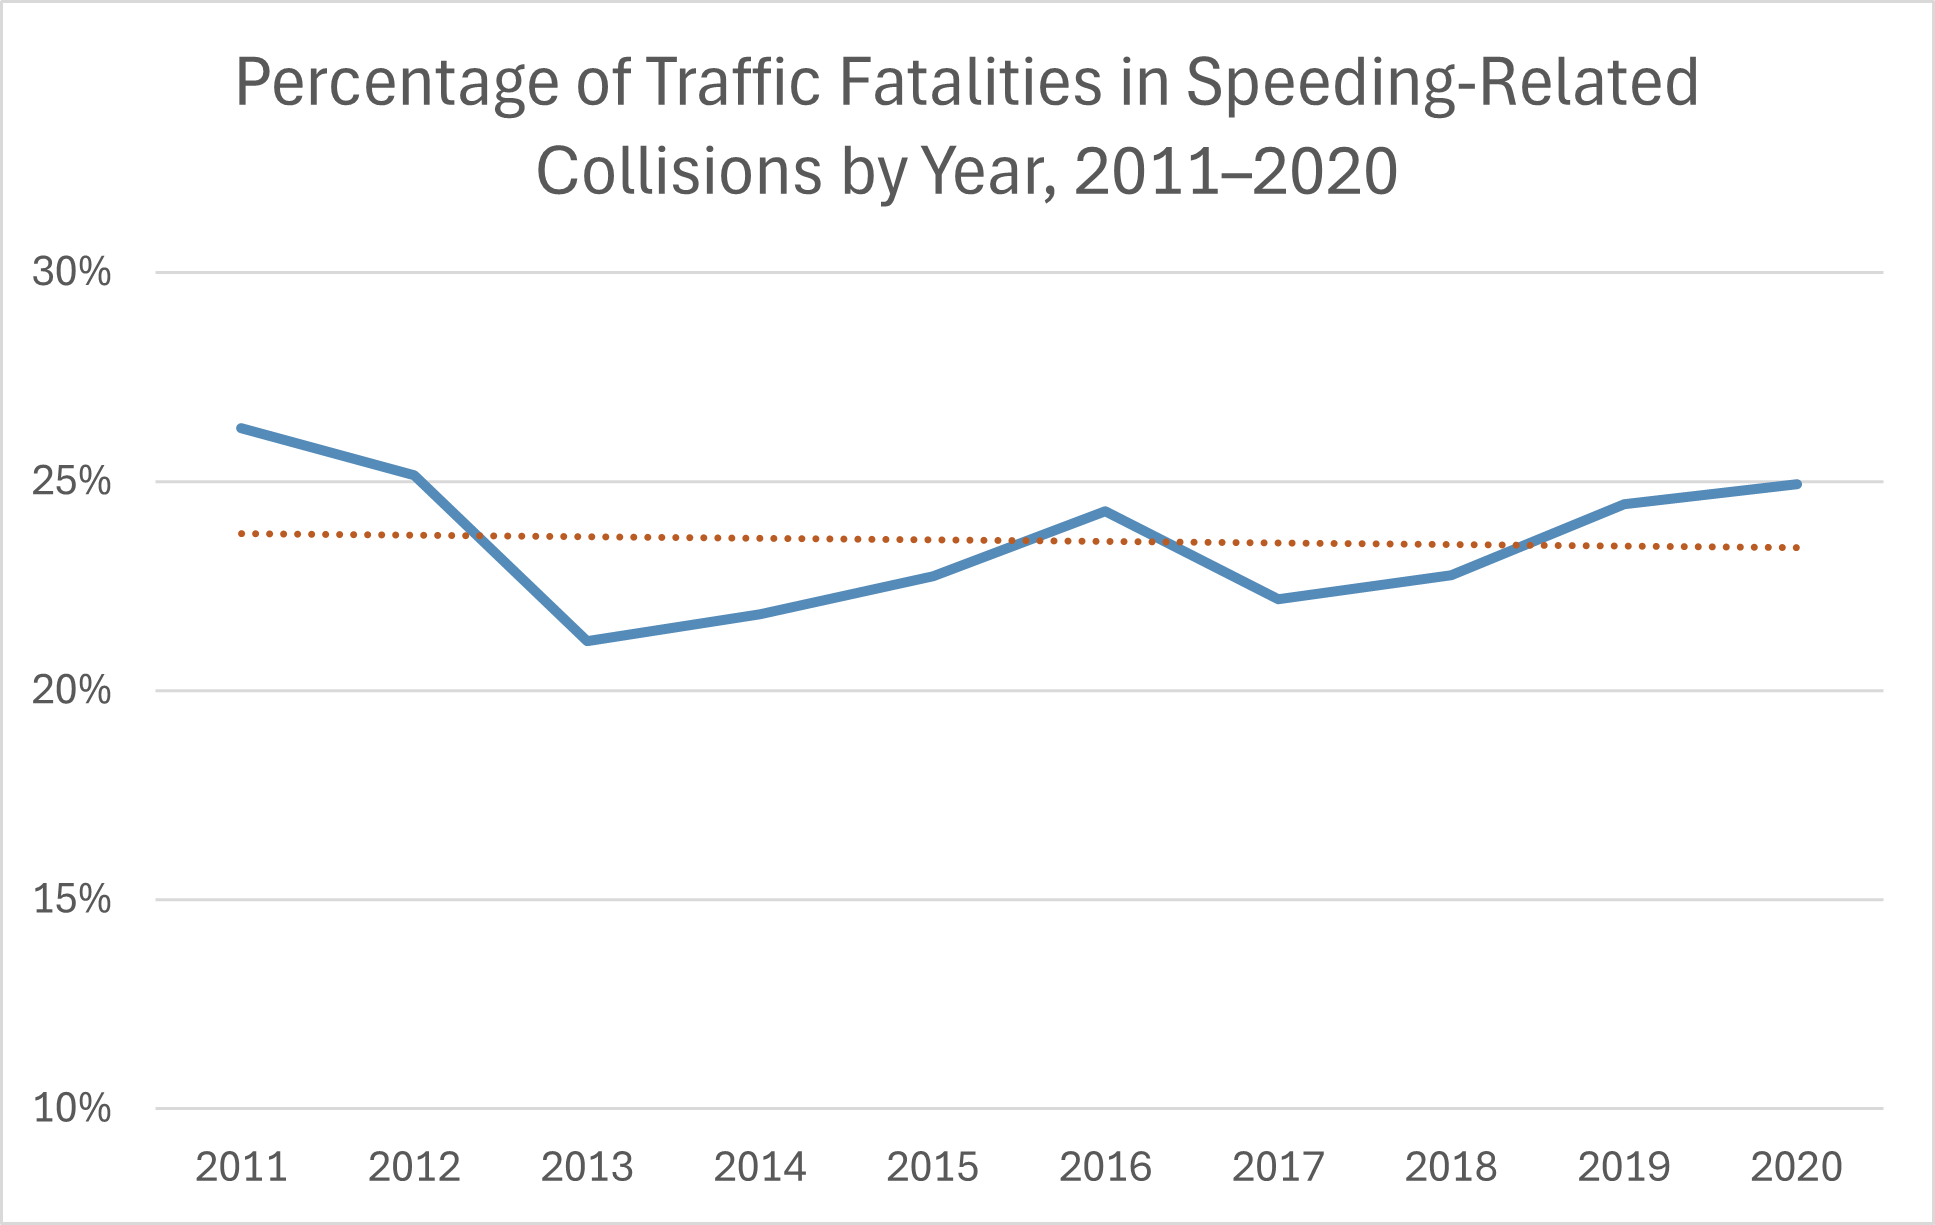
- The following chart shows the percentage of traffic fatalities in speeding-related collisions for each year from 2011 to 2020. In 2011, the percentage was 26.3%, and in 2020, it was 25.0%. The average over this period was 23.6%. There was not a significant ten-year downtrend. The slope of the linear regression line is only very slightly negative: 0.038% per year. Also, the p-value for the slope is 0.85, so the null hypothesis of “no linear trend” cannot be rejected. (Transport Canada, December 2022)
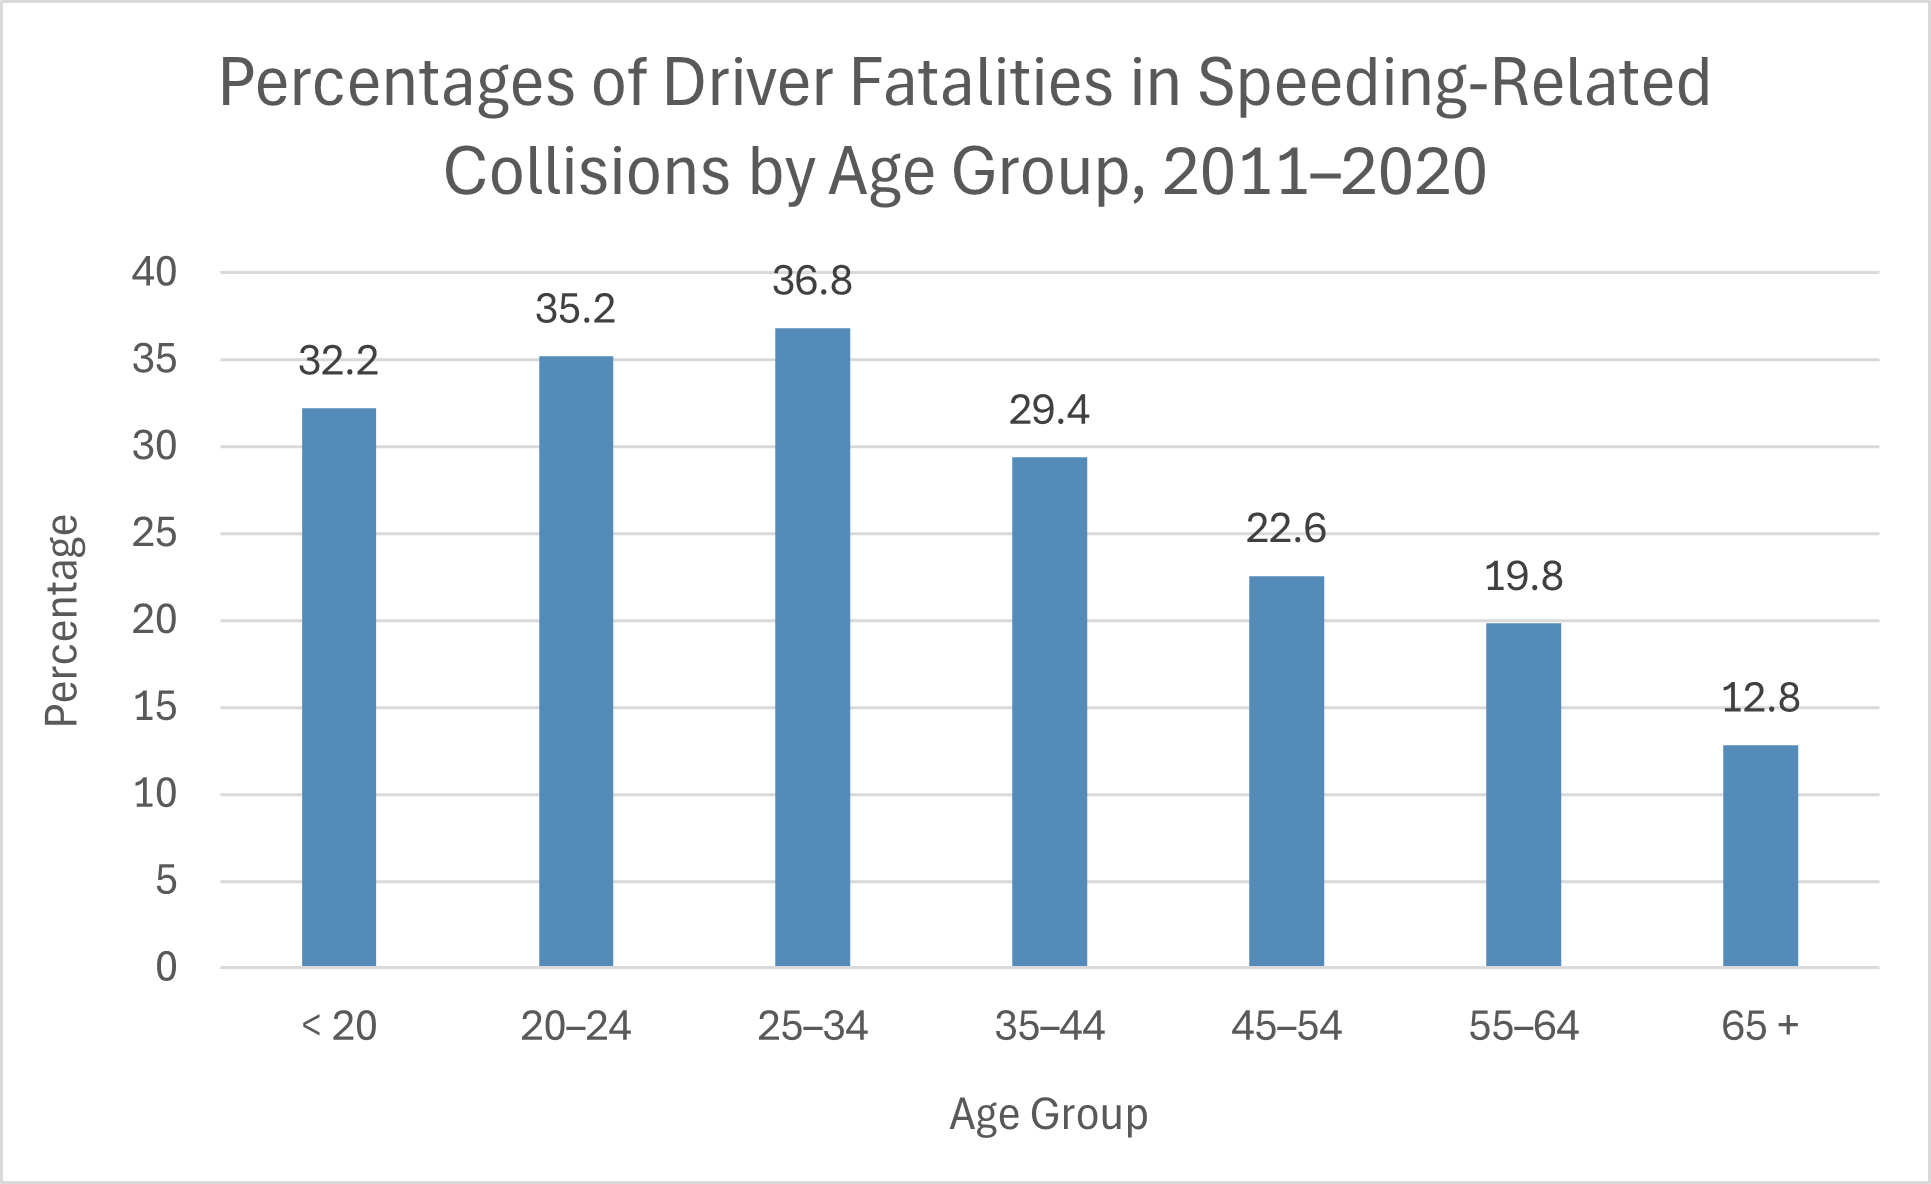
- The next chart shows for each age group the percentage of driver fatalities that occurred in speeding-related collisions, averaged over the period 2011–2020. 36.8% of fatally injured drivers aged 25–34 died in speeding-related collisions, more than any other age group. On the other hand, 12.8% of fatally injured drivers aged 65 and older died in speeding-related collisions, the smallest such percentage of all age groups. (Transport Canada, December 2022)
- In a poll of drivers in October 2023, 22% of respondents admitted to speeding in residential neighborhoods, and 19% of respondents admitted to driving well over the speed limit. (Cision Canada, January 2024)
- In a survey of Ontario drivers in 2022, 83% of respondents said they had witnessed other drivers speeding, and 43% of respondents admitted to speeding themselves. (CAA SCO, 2022)
- A 1% increase in a vehicle's speed increases the driver’s fatality risk by 4% to 12%. An increase of the speed limit by 15 km/h on a road increases the fatality rate of drivers by 10%. The risk of being involved in a severe crash is twice as great at 65 km/h than it is at 60 km/h. Injuries from a crash at 50 km/h are comparable to injuries caused by falling from a three-story building. Injuries from a crash at 100 km/h are comparable to injuries caused by falling from a twelve-story building. (Traffic Injury Research Foundation, February 2014)
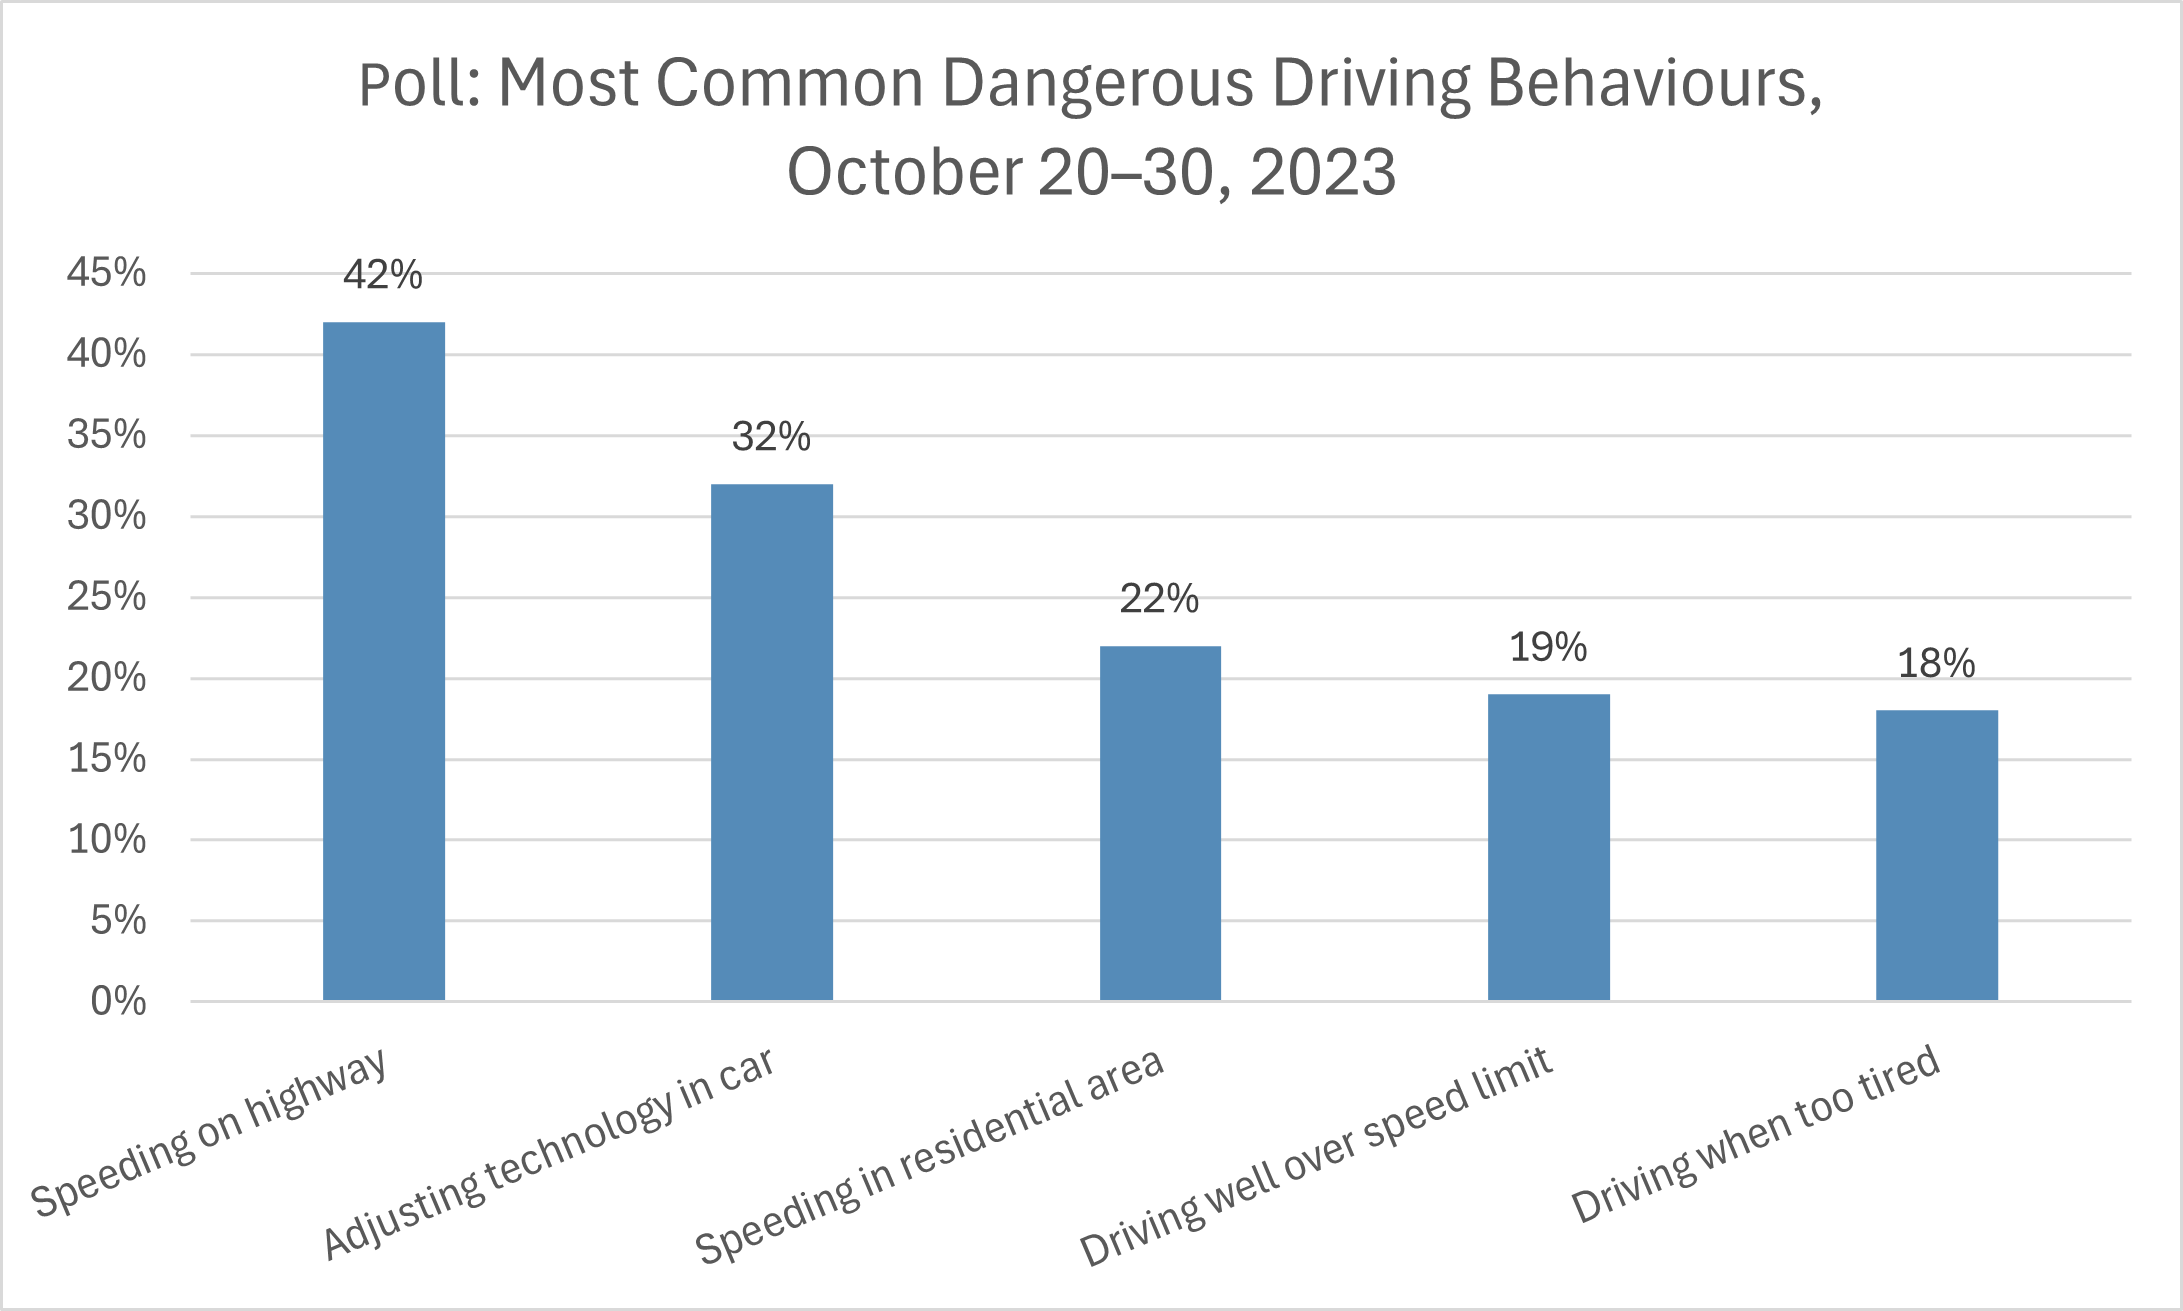
- A CAA poll of 2,503 Canadians carried out in October 2023 found that 88% of them were “deeply worried” about speeding in residential areas. Nevertheless, 22% of them admitted to speeding in residential areas themselves, at least occasionally. CAA also asked these respondents to list the top dangerous driving behaviours they engaged in themselves. The top five were speeding on the highway (45%), interacting with technology in their car (32%), speeding in residential zones (22%), driving well over the speed limit (19%), and driving when too tired (18%). (CAA, January 2024)
Accidents
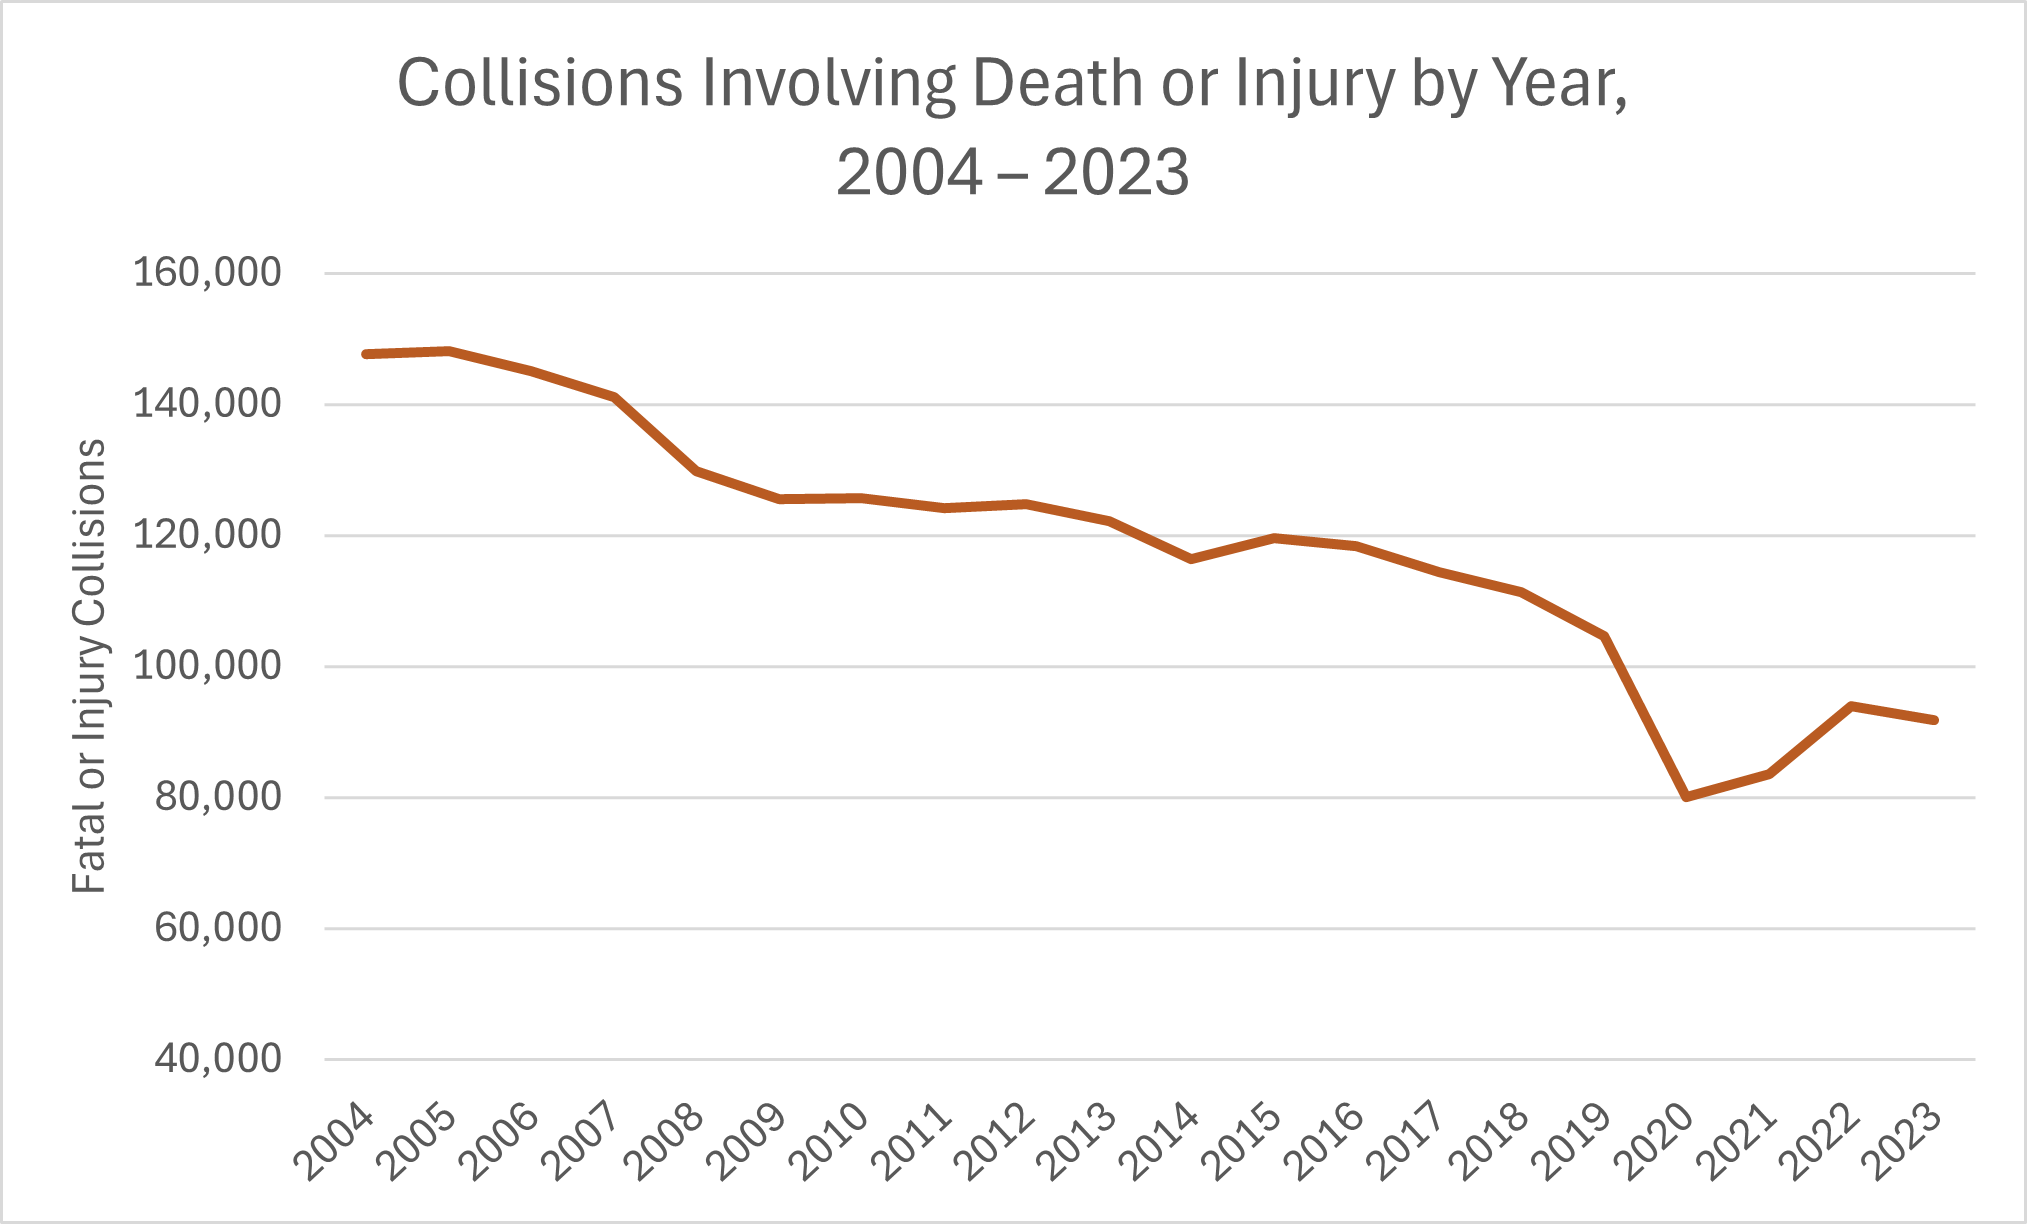
- In 2023, there were 91,750 traffic collisions involving injuries, fatalities, or both. However, this figure is 37.8% lower than the 147,588 serious collisions that occurred in the year 2004. The number of serious collisions has generally trended downward over the period 2004 – 2024 despite Canada’s growing population. See the following chart. (Transport Canada, May 2025)
- A naturalistic driving study comparing 90 new adolescent drivers with 131 experienced adult drivers in the United States found that the adolescent drivers’ crash/near-crash rate per mile driven (CNC) was moderately (67%) higher during their supervised learner period. However, their CNC rate was dramatically higher (by a factor of 6.51) during their first year of licensure when they were driving unsupervised. (US National Institutes of Health, 2018)
- From 2002 to 2021, an average of 18.7% of traffic collisions each year occurred under conditions of adverse weather, including rain (9.5%); snowfall (6.5%); and freezing rain, sleet or hail (0.6%); among others. (Canada National Collision Database, accessed June 2025)
- In 2021, rear-end collisions accounted for 21.1% of all traffic collisions, more than any other type of collision. (Canada National Collision Database, November 2023)
- In 2021, 50.7% of traffic fatalities resulted from multi-vehicle collisions, and 49.3% of fatalities resulted from single-vehicle events (such as a rollover or a collision with a stationary object). (Canada National Collision Database, November 2023)
- In 2021, the six most common types of fatal collisions were as follows: head-on collision with another vehicle (25% of total fatal collisions), running off the right shoulder (14%), running off the left shoulder (13%), right-angle (side) impact from another vehicle (11%), hitting a stationary object (10%), and being rear-ended by another vehicle (9%). (Canada National Collision Database, November 2023)
- Transport Canada estimated the total social cost of traffic collisions in 2020 as $36 billion. (Social cost includes the costs of deaths, injuries, and the mobilization of emergency services.) This figure represented about 1.9% of Canada’s Gross Domestic Product that year, or $947 per capita. Still, the social cost of collisions per capita when measured in real (inflation-adjusted) dollars has trended almost steadily downward since 1996, with $947 in 2020 being the lowest cost per capita to date. (Transport Canada)
- Each year, over 100 Canadians are killed or seriously injured from railway crossing attempts or trespassing on railways. A motorist is 40 times more likely to be killed in a collision with a train than in a collision with another vehicle. (Operation Lifesaver Canada, 2025)
- Most collisions between vehicles and trains happen within 40 km of the motorist’s home. 66% of train-vehicle collisions happen at crossings with active warning devices (such as gates, lights, or bells). (Operation Lifesaver Canada, 2025)
- There are about 40,000 railway crossings in Canada. In 2023, there were 149 railway crossing accidents and 80 trespassing accidents, resulting in 13 fatalities (the lowest since 2013) and 19 serious injuries. (Transportation Safety Board of Canada, February 2024)
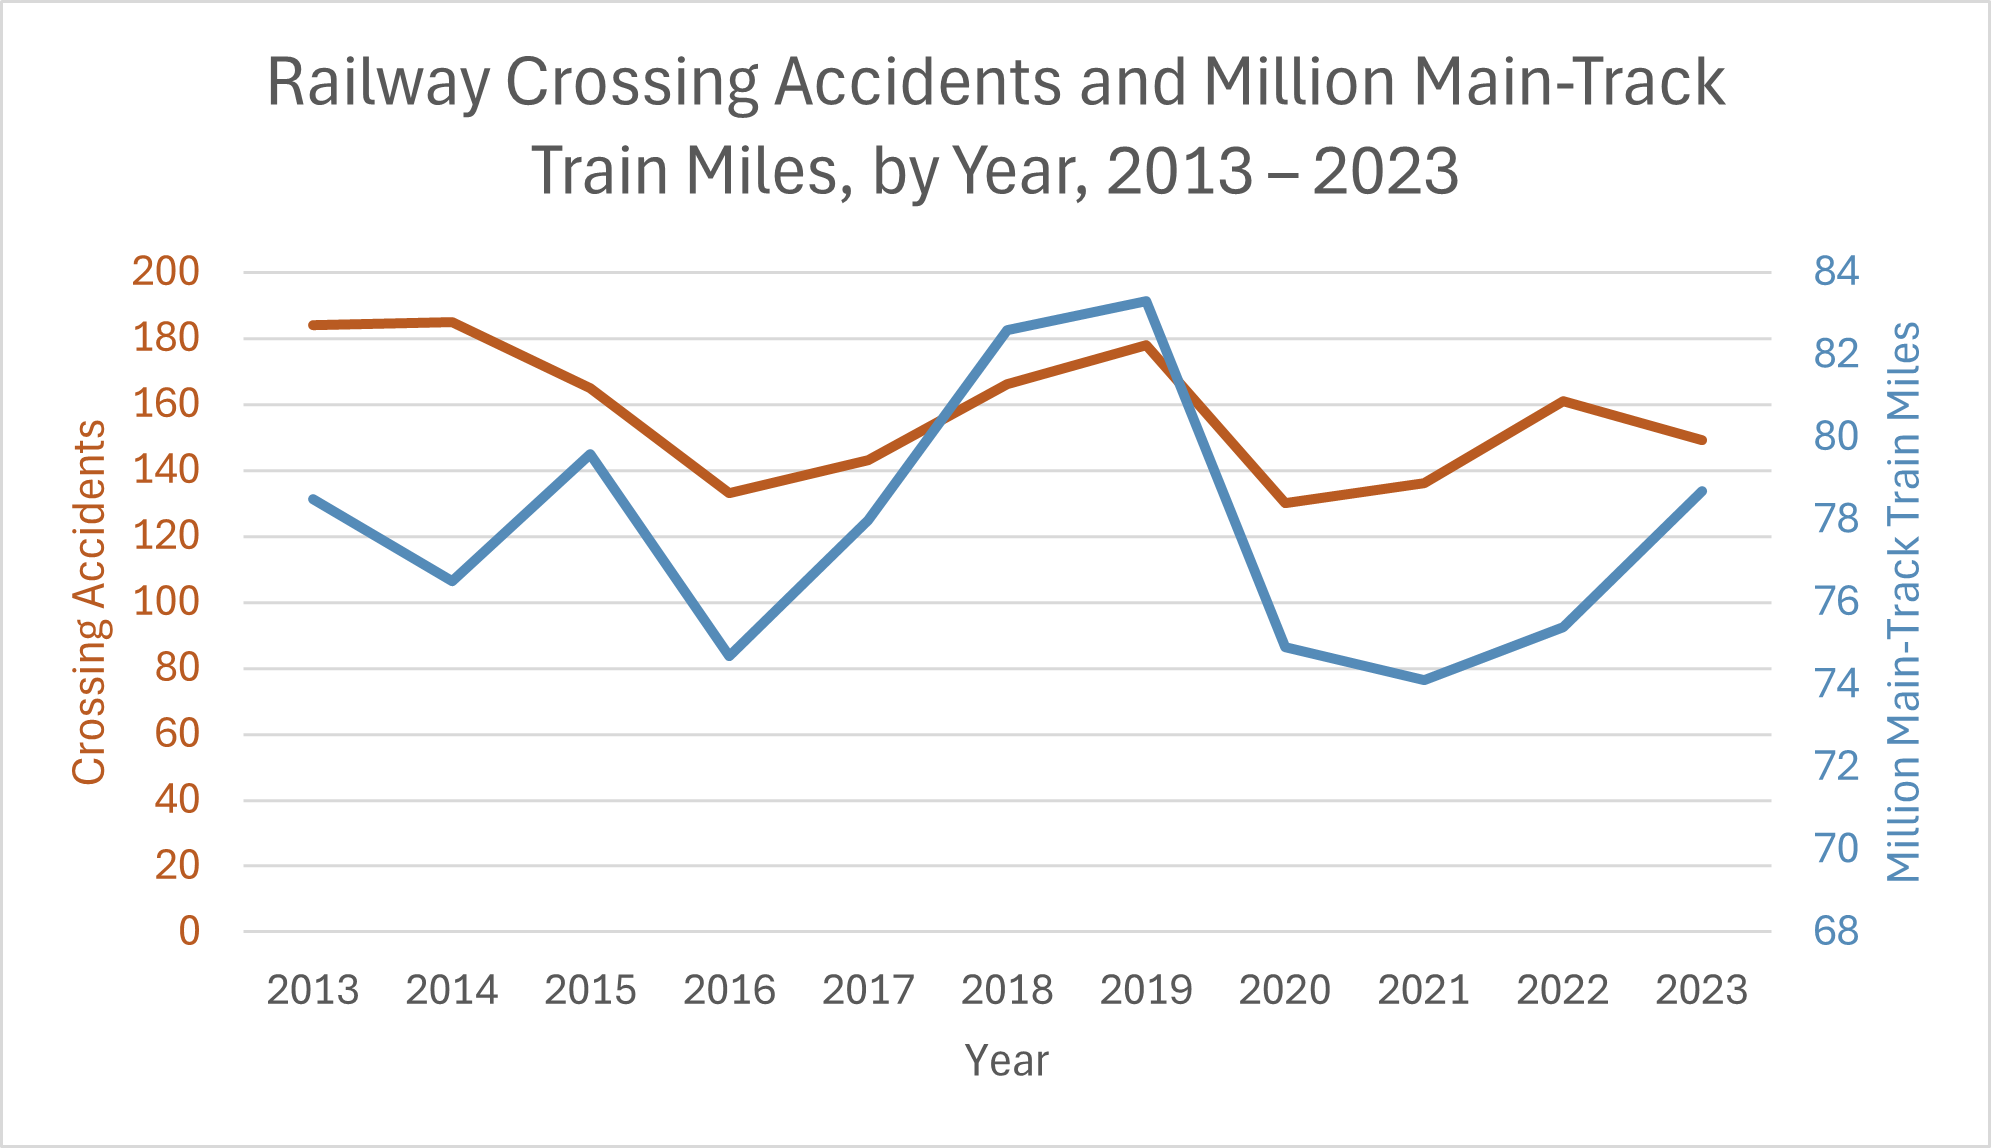
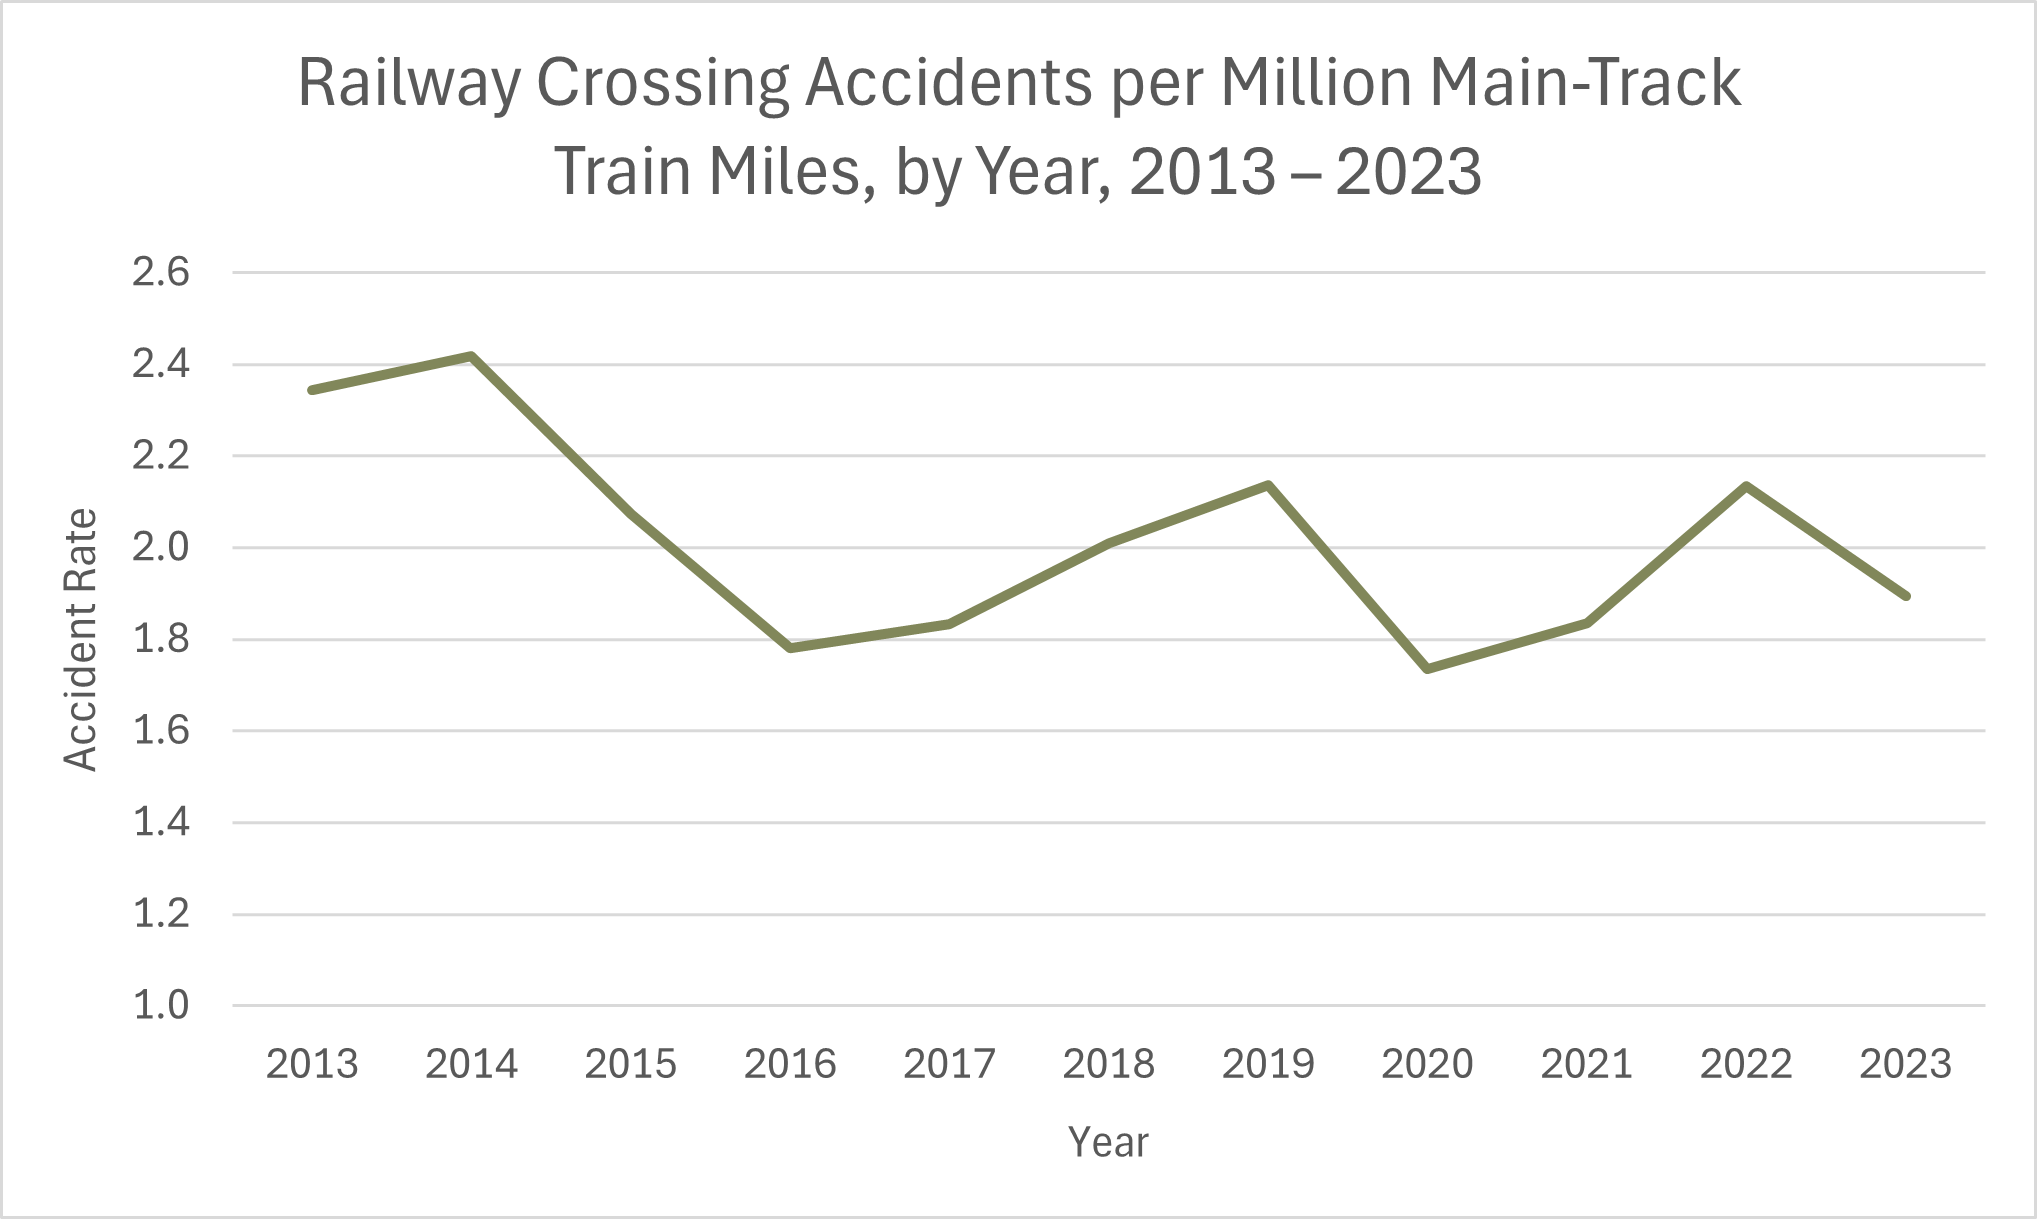
- The number of railway crossing accidents declined from 184 in 2013 to 149 in 2023. As you would expect, the number of accidents each year correlated strongly with the millions of train miles travelled that year. Still, the rate of crossing accidents per million main-track train miles travelled also declined from 2013 to 2023. See the following two charts. (Transportation Safety Board of Canada, February 2024)
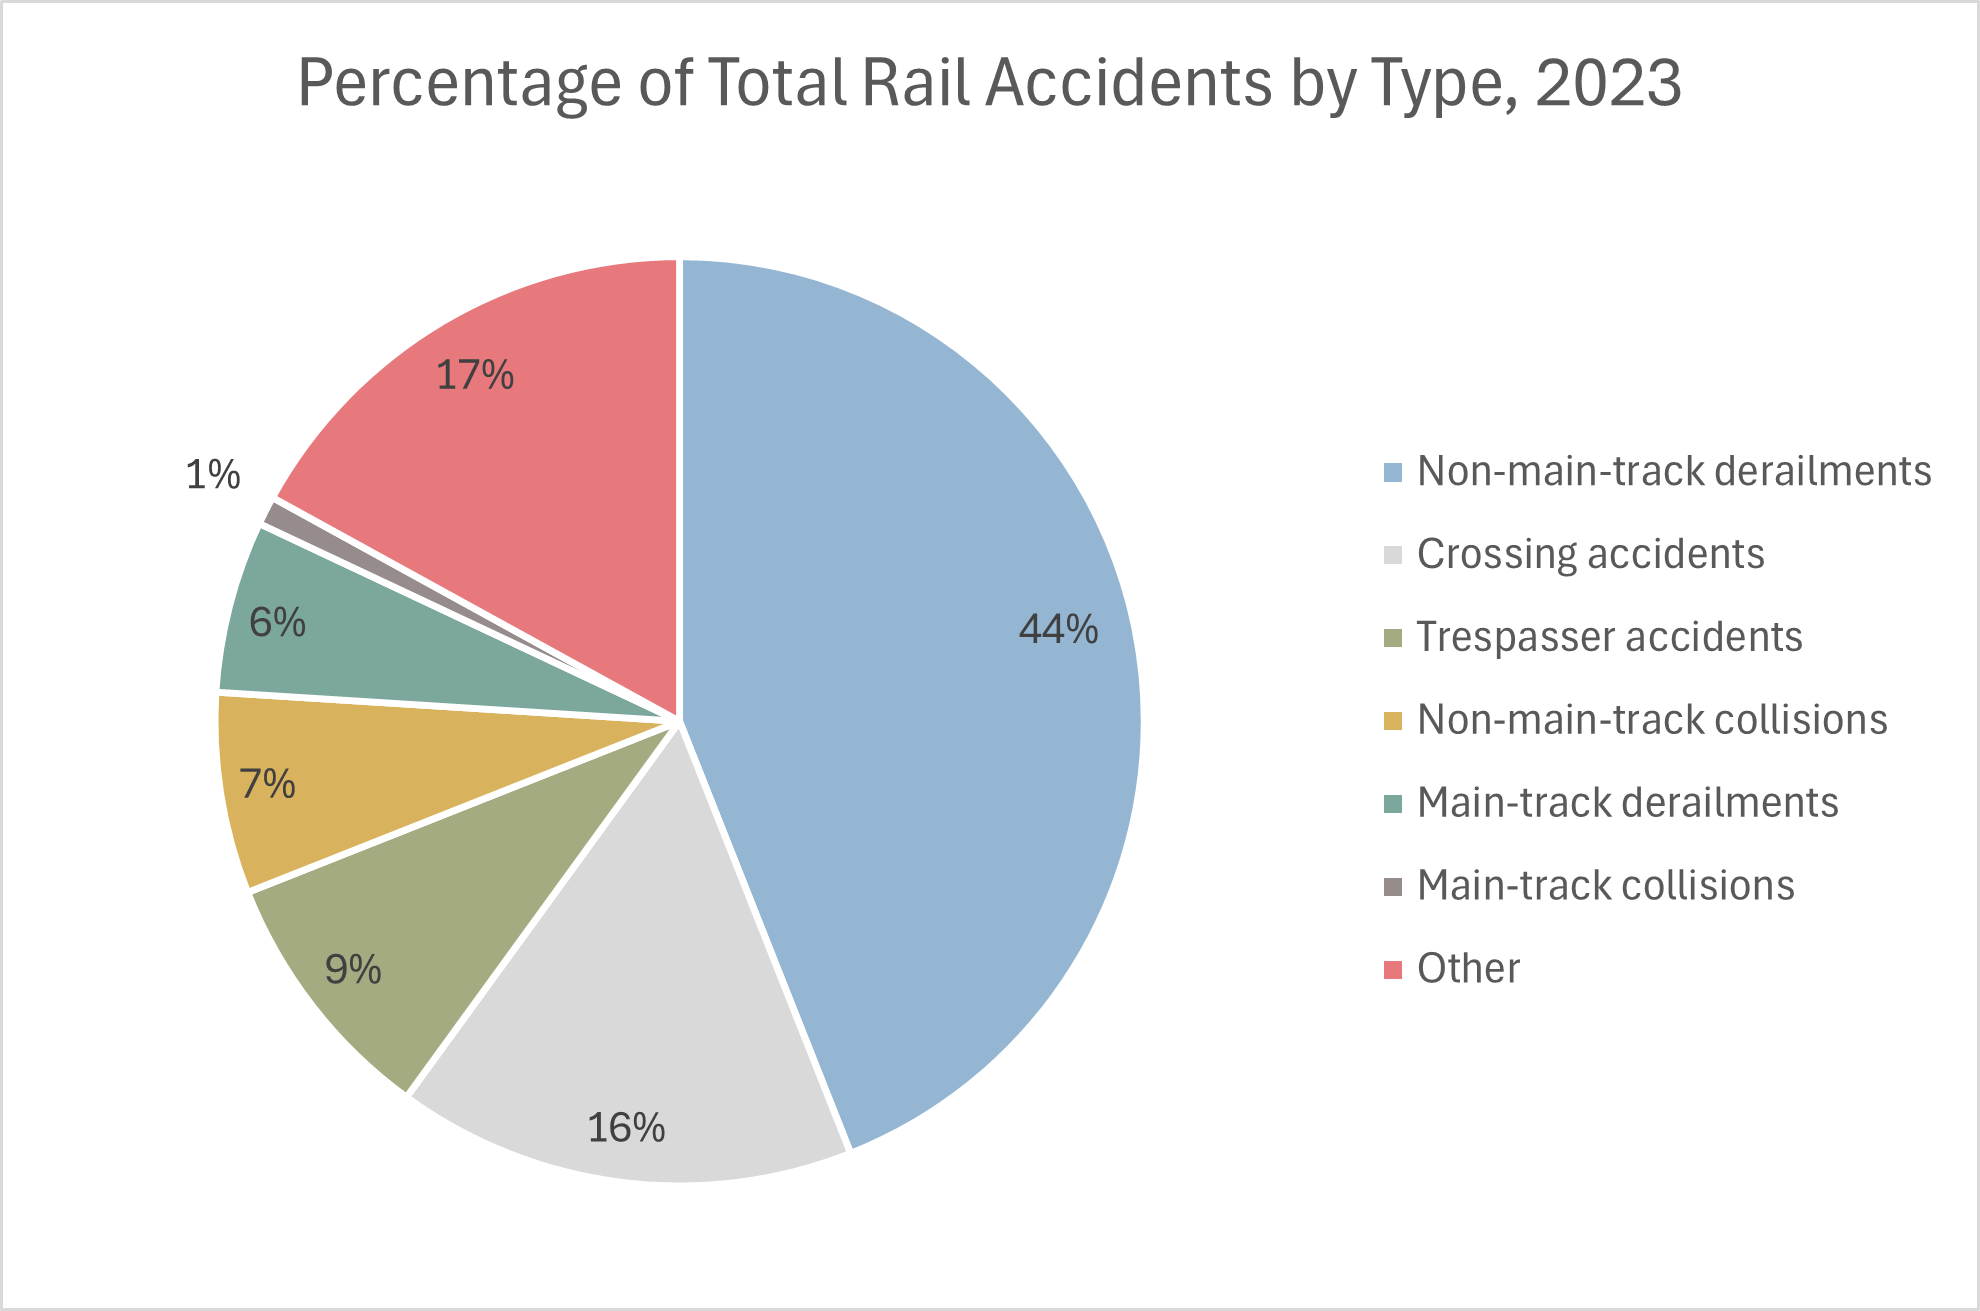
- Combined, railway crossing accidents and trespasser incidents made up one-fourth of all rail accidents in 2023. Railway crossing accidents alone made up 16% of all rail accidents. See the following chart. (Transportation Safety Board of Canada, February 2024)
Driving Ability
- In 2018, the Insurance Corporation of British Columbia (ICBC) found that over 40% of drivers scored lower than 80% on ICBC’s Drive Smart Refresher Test, a 20-question knowledge test of driving rules. (On the official knowledge test of driving rules, 80% is the usual minimum passing score.)
- More than 90% of road crashes are the result of human error or condition. (Traffic Injury Research Foundation, 2019)
Aggressive Driving
- A survey of Canadian drivers in 2017 found that 31% of them admitted to having driven through a red light, and 29% of them admitted to disobeying road signs while driving. (belairdirect, 2017)
- A study of five busy US intersections without red-light cameras found that motorists ran red lights at an average of about once every 20 minutes at each intersection. Another study of 19 intersections without red-light cameras in four US states found that drivers ran red lights at an average rate of 3.2 per hour per intersection (i.e., once every 19 minutes at each intersection). (IIHS, June 2024).
- A survey of 1,027 Canadian drivers in 2021 found that more than one-third of them admitted to engaging in various aggressive driving behaviours. The most common was speeding (33% of surveyed drivers). 9% of drivers admitted to running a red light. Smaller but still significant percentages admitted to even riskier behaviours. See the following chart. (Finder.com, September 2021)
- Male and younger drivers ages 19–39 were significantly more likely to engage in aggressive behaviours. (AAA Foundation for Traffic Safety, 2016)
- In a poll of 2,009 Canadians from November to December 2021, respondents listed the following aggressive driving behaviours as serious threats to their safety: running red lights (93%), aggressive driving generally (92%), speeding on residential streets (91%), and driving well over the speed limit (90%). (CAA, December 2021)
- In a poll of 2,503 Canadians from October 20 to October 30, 2023, 22% of respondents admitted to speeding in residential neighborhoods.
- See also the sections Driver Attitudes and Speeding Statistics.
Pedestrian Safety
- From 2018 to 2020, the rate of pedestrian fatalities in traffic collisions was 1.01 deaths per 100,000 population for males, compared with only 0.61 deaths per 100,000 population for females. (Statistics Canada, October 2023)
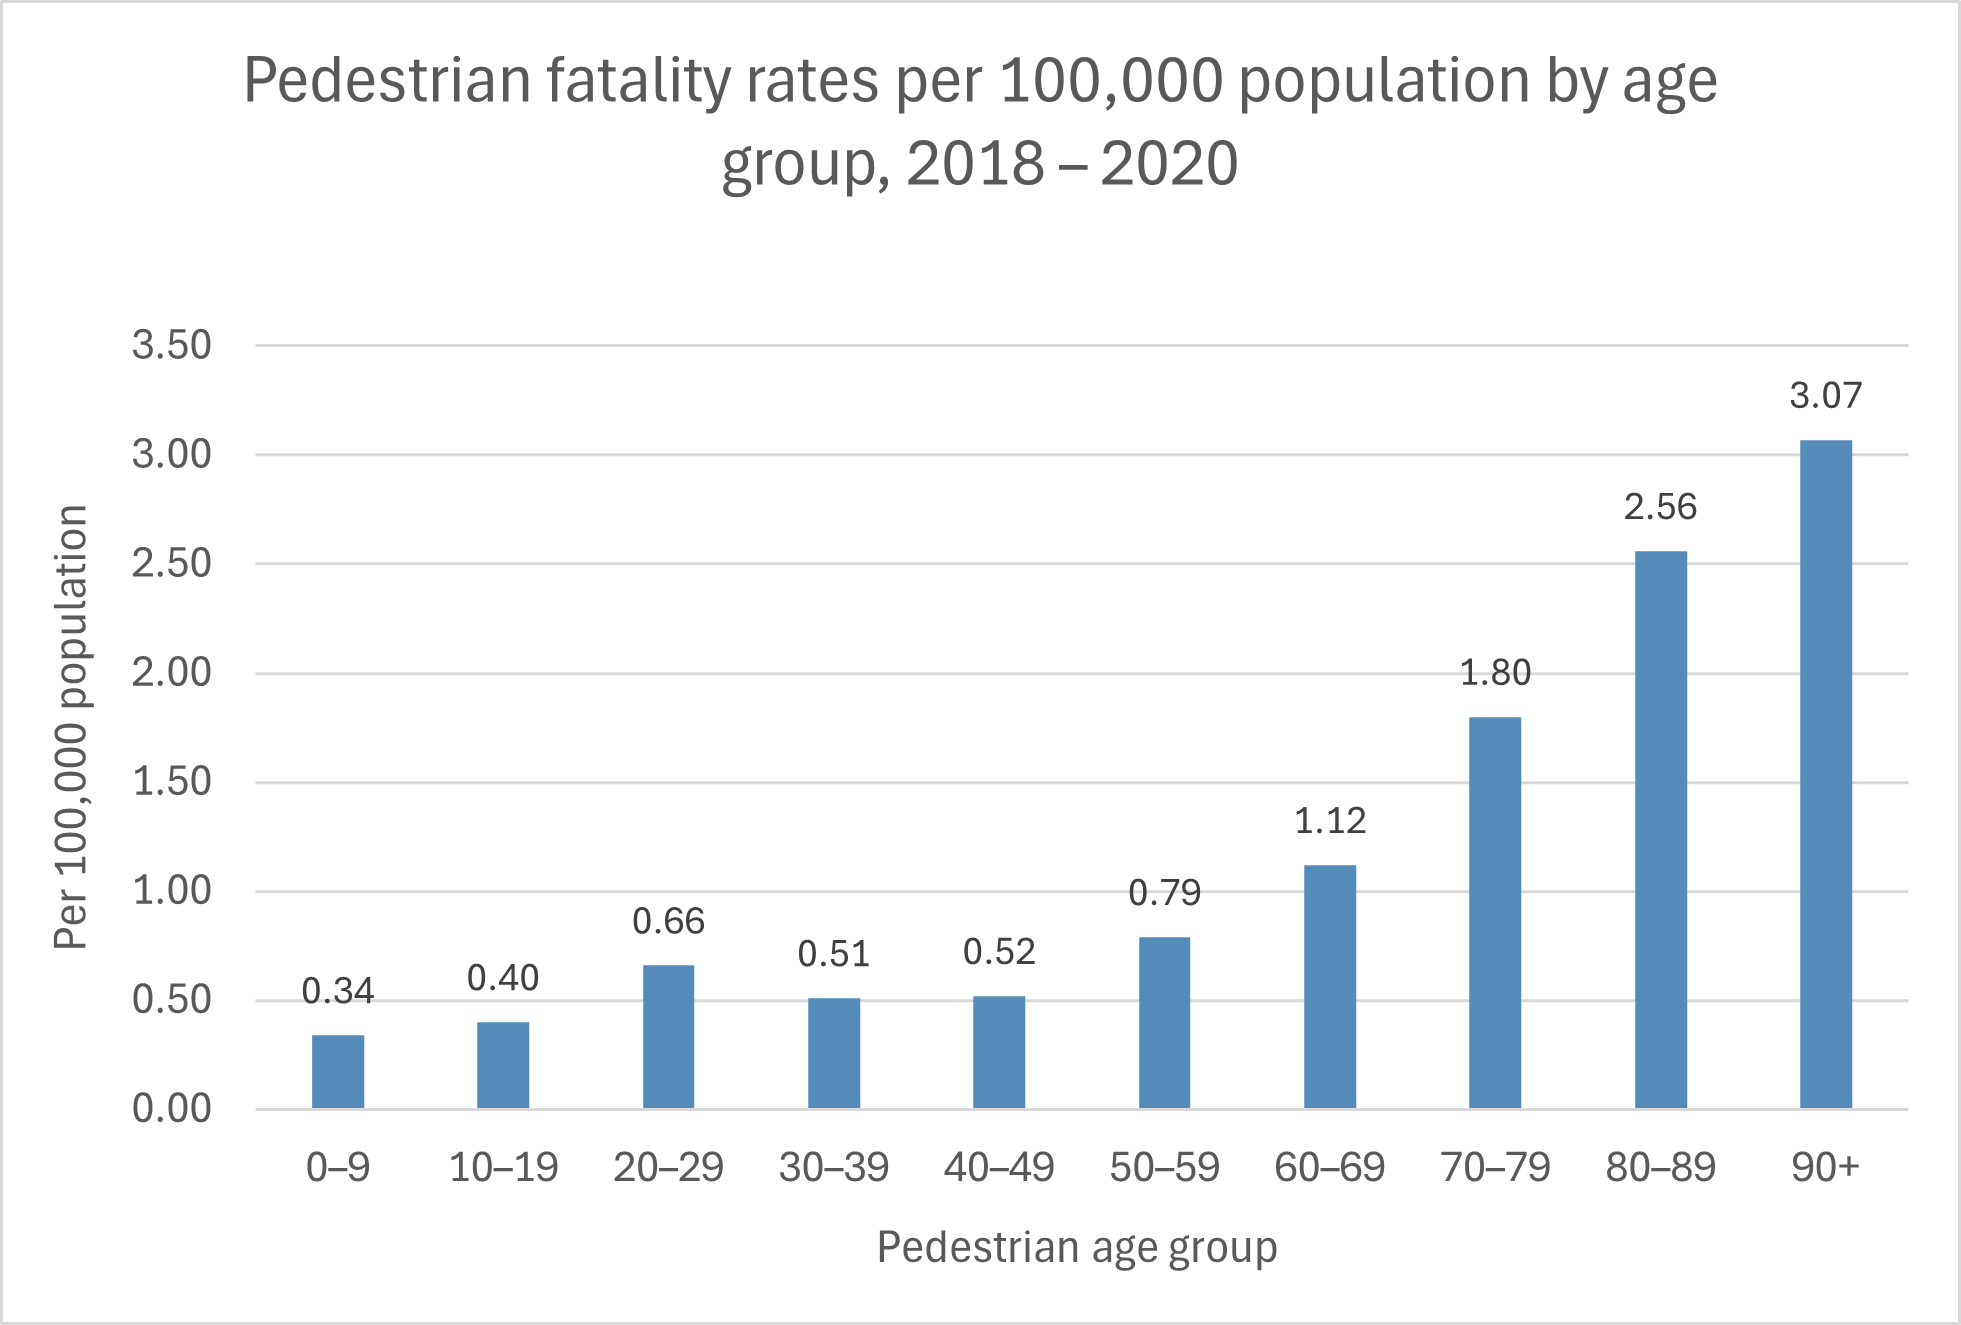
- From 2018 to 2020, the rate of pedestrian fatalities was 2.65 deaths per 100,000 population for males aged 70 years and older, compared with 0.80 deaths per 100,000 population for males aged 69 years and younger. In comparison, among women aged 70 and older, the fatality rate was 1.68 deaths per 100,000 population. Considering both males and females, the pedestrian fatality rate for pedestrians aged 90 and older was 3.07 per 100,000 population – about six times as high as for pedestrians aged 30 to 49. See the following chart. (Statistics Canada, October 2023)
- From 2018 to 2020, the most common locations for pedestrian fatalities were intersections (21% of all pedestrian fatalities), roadways not at intersections (14%), highways (13%), parking lots or private property (10%), and railways (8%). (Statistics Canada, October 2023)
- From 2018 to 2020, the most common risk factors for pedestrian fatalities were as follows: (Statistics Canada, October 2023)
- Nighttime (26% of all pedestrian fatalities)
- Environmental factors (such as adverse weather, limited visibility or poor road conditions) (23%)
- Drugs or alcohol (consumed by the driver or the pedestrian) (20%)
- Other modifiable factors (such as distractions, vehicle speed, vehicle mechanical issues, or improper lane change or turn) (15%)
- Pedestrian wearing dark clothing (9%)
- Pedestrians have a 90% chance of surviving a crash at 30 km/h (19 mph) or less but only a 50% chance at higher speeds. (AutoInsurance.org, 2018)
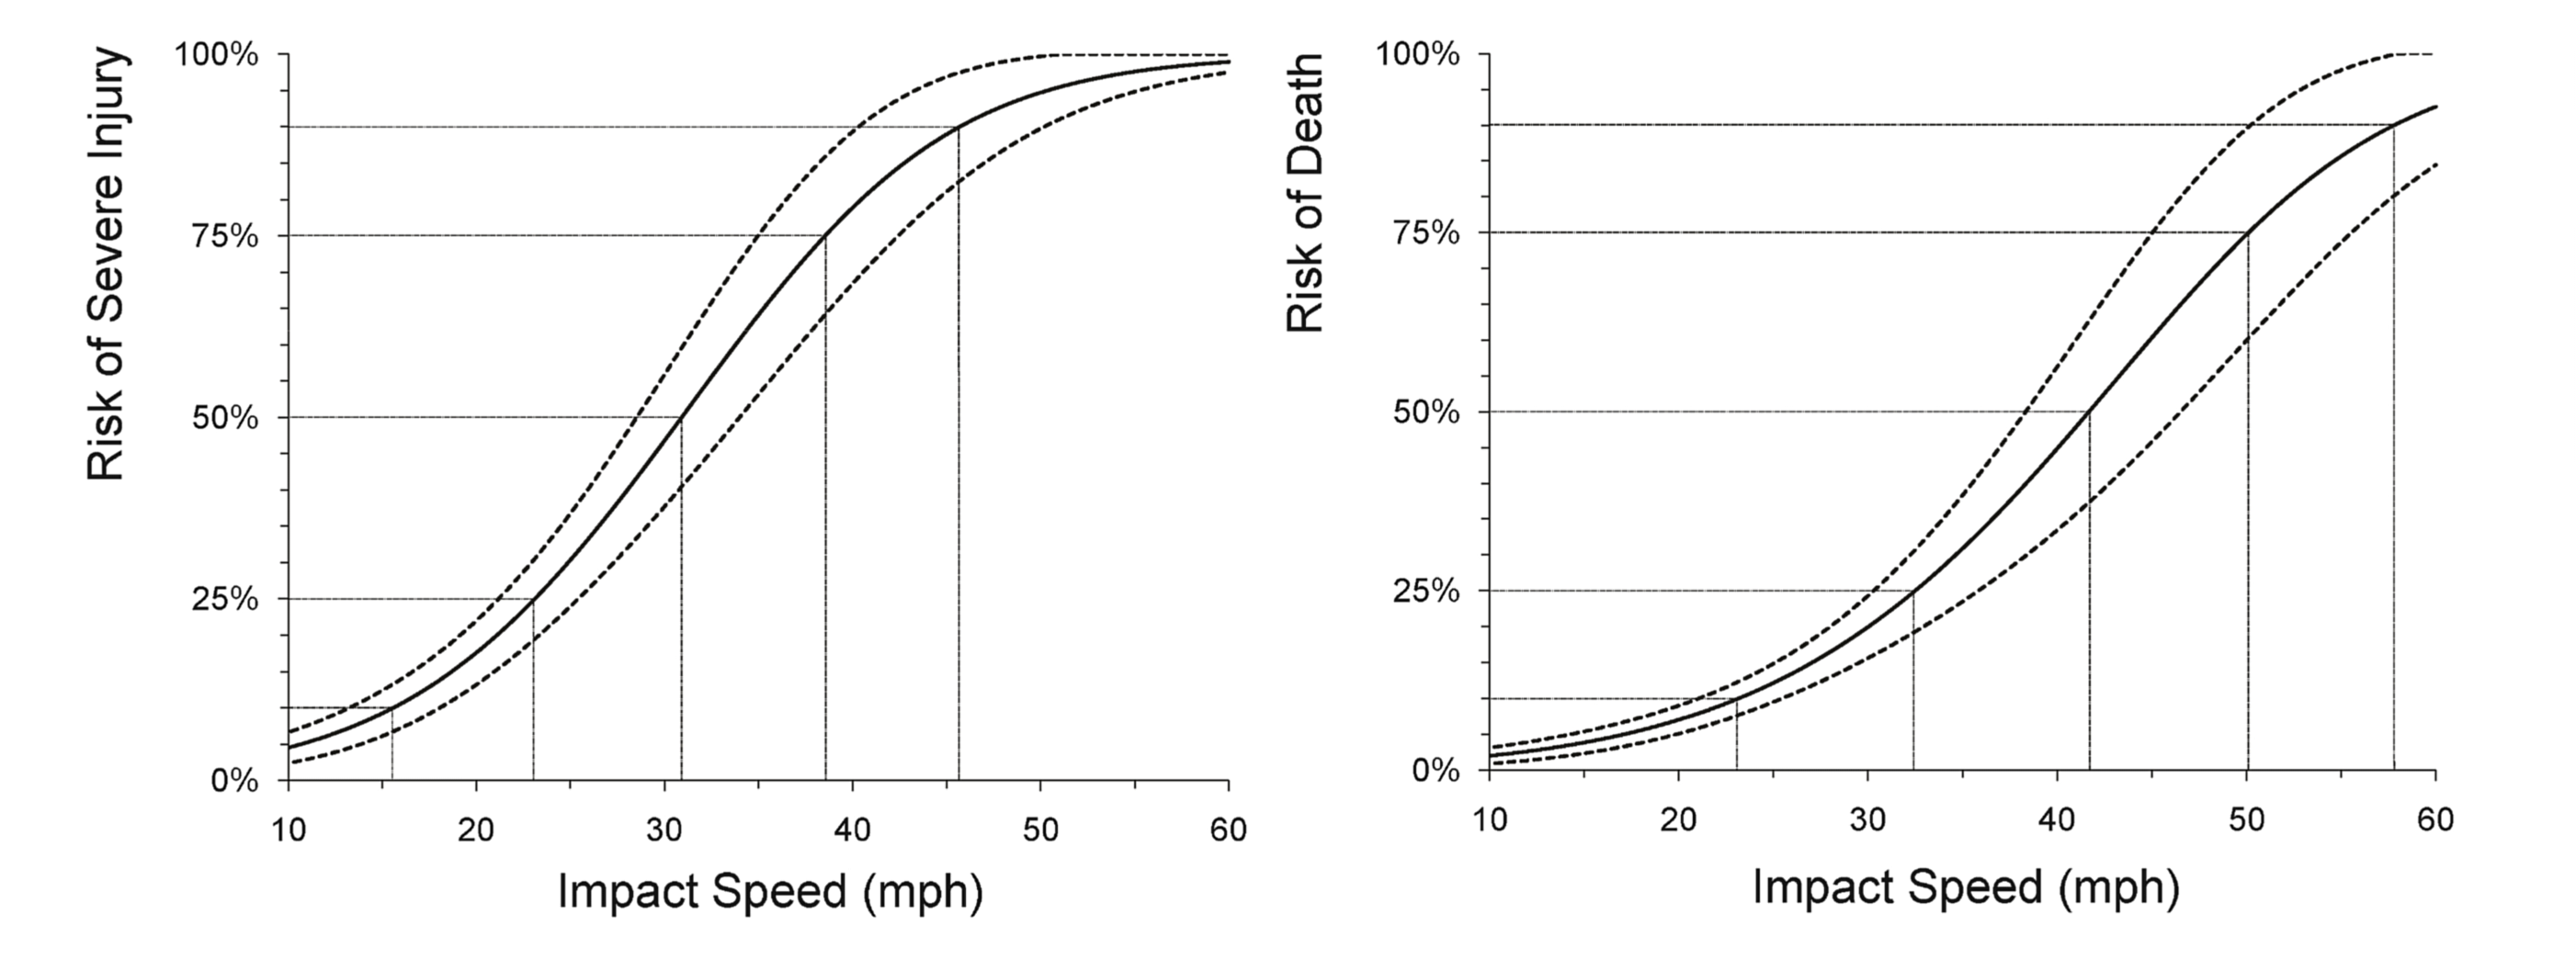
- For a pedestrian, the risk of death or serious injury increases along an S-shaped curve as the vehicle impact speed increases. The following charts from the AAA Foundation for Traffic Safety show the risk of severe injury to a pedestrian and the risk of death to a pedestrian as a function of vehicle impact speed. The risk was calculated from a sample of 422 pedestrians who had been struck by a car or light truck during the years 1994 through 1998. (AAA Foundation for Traffic Safety, 2011; NHTSA, 2023)
- A pedestrian who is struck at 32 km/h (20 mph) has a 10% chance of dying. A pedestrian who is struck at 64 km/h (40 mph) has an 80% chance of dying. (Active Transportation Alliance, 2018)
Bicyclist Safety Statistics
- Despite Canada’s generally colder climate, the percentage of commuting trips taken by bicycle in Canada is far higher than the corresponding percentage in the United States. In May 2024, 6.0% of commuters in Canada walked or bicycled to work. In the United States in August 2023, just 0.6% of commuters in the United States bicycled to work, although this percentage rose to 1.1% in large American cities. However, all these percentages were dwarfed by the 58% of Netherlands commuters who bicycled to work in August 2023 – the highest percentage of bicycling commuters in any country. (RunRepeat, August 2023; Statistics Canada, February 2025)
- According to the 2021 Census, about 1.1% of Canada’s commuters rode a bicycle to or from work. 66.5% – about two-thirds – of these biking commuters were male, and 33.5% were female. (Statistics Canada, August 2024)
- As of October 2024, just 16% of Canadians bicycled at least once a week, compared with 25% of the US population and 35% of the world’s population. In comparison, 67% of the population of India bicycled at least once a week, the highest percentage of any country. (Made in CA, January 2024)
- An average of 74 cyclists die in crashes each year. About 73% of those crashes involve a collision with a motor vehicle. Another 25% of those crashes involve a collision with another cyclist or a stationary object. (CAA, 2020) However, because of Canada’s growing population, the fatality rate of cycling decreased from 2.5 deaths per one million population in 2006 to 1.3 deaths per one million population in 2017. (Statistics Canada, July 2019)
Wildlife Safety Statistics
- Over 45,000 non-fatal (to humans) collisions with wildlife occur each year. (Traffic Injury Research Foundation, 2020)
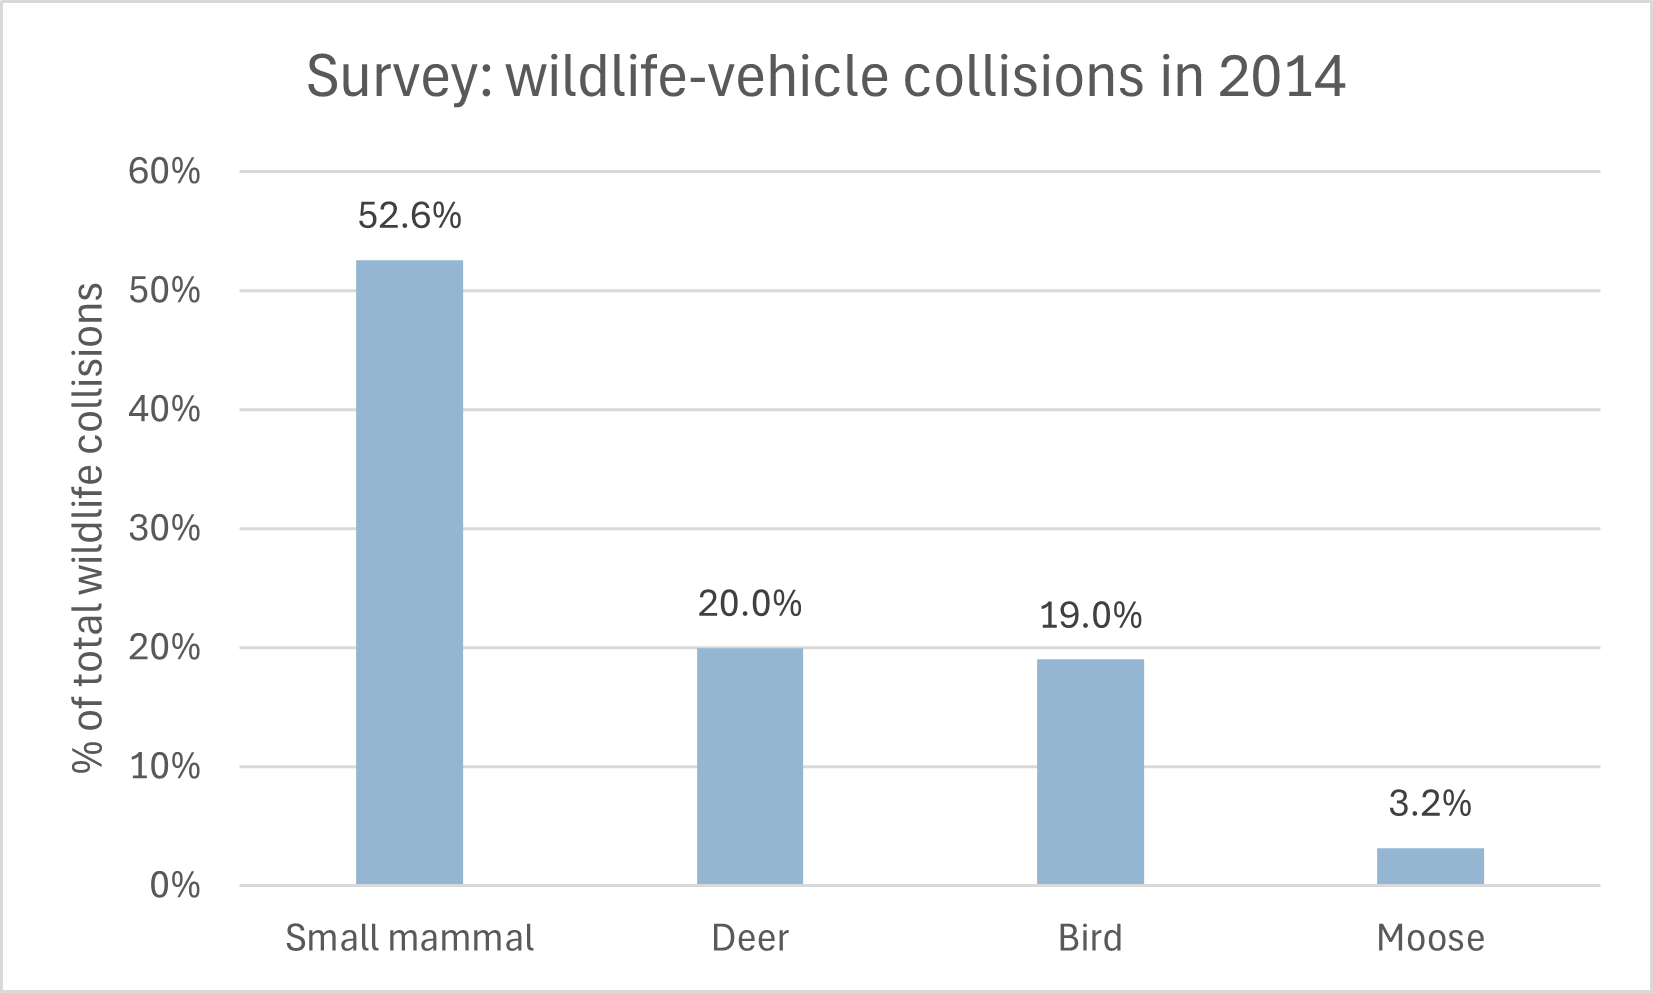
- In a survey of Canadian drivers conducted in 2014, 9.2% of drivers reported having at least one collision with an animal. Most of these drivers reported collisions with a small mammal, such as a fox or squirrel. See the following chart. (Traffic Injury Research Foundation, September 2016)
- Between 2000 and 2020, 570 persons were killed in wildlife-vehicle collisions, representing about 1.1% of all traffic fatalities. 393 (68.9%) of these fatalities resulted from hitting the animal, and 31.1% of the fatalities resulted from swerving to avoid hitting the animal. 52% of these crashes were collisions with a moose, 32% were collisions with a deer, and 6% were collisions with other animals. In that period, there was a long-term downward trend in wildlife-vehicle collision fatalities, from 34 fatalities in 2000 to 26 fatalities in 2020, although there were several sharp rises along the way. (Traffic Injury Research Foundation, November 2023)
Winter Driving Statistics
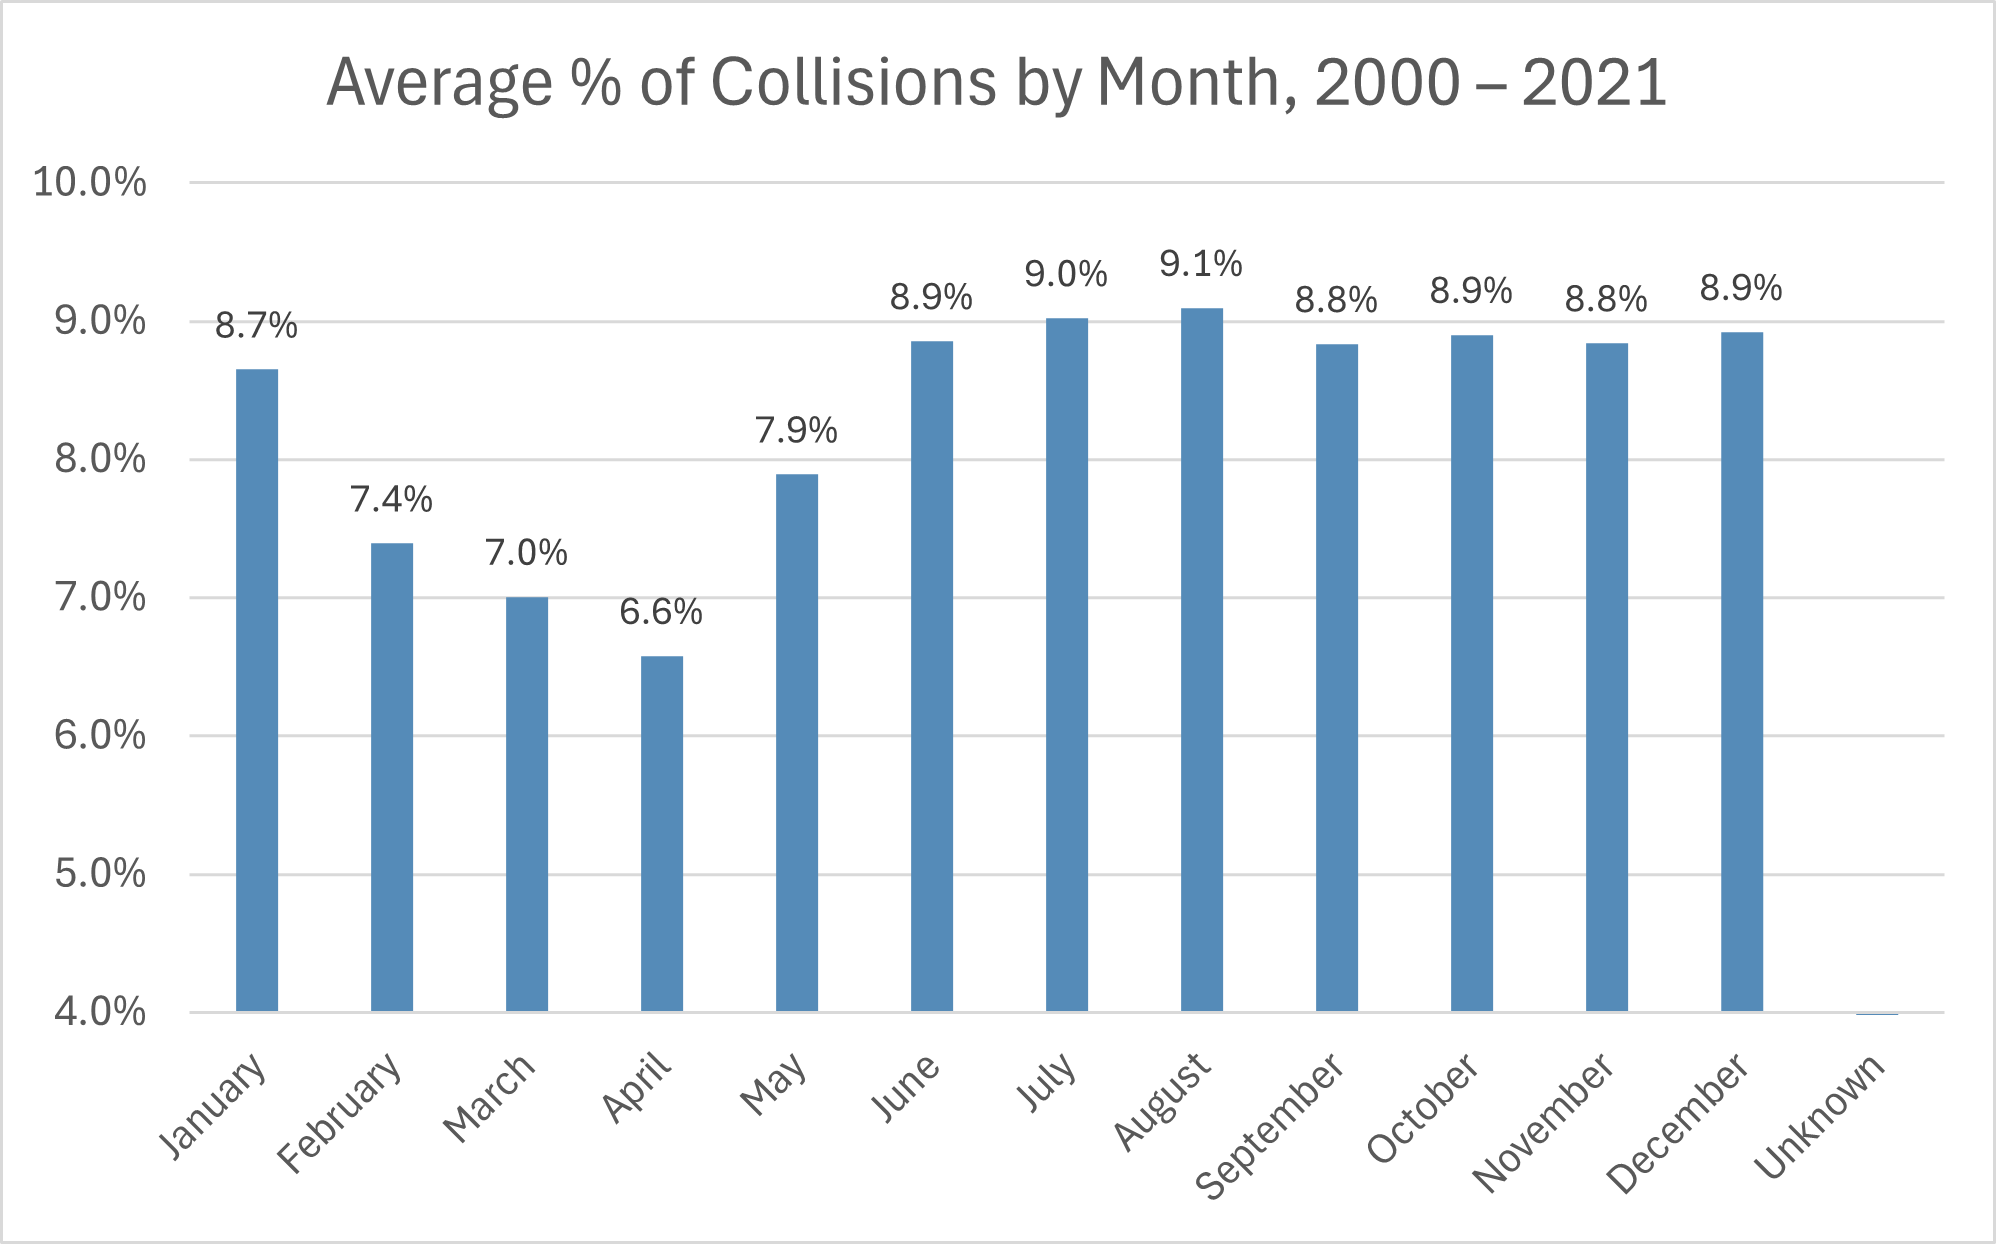
- From 2000 through 2021, an average of 9.1% of collisions each year took place in August, more than in any other month. An average of 6.6% of collisions each year took place in April, less than in any other month. See the following chart. (Canada National Collision Database, November 2023)
- In the year 2010, snow drift was a factor in over 500 accidents. Packed snow or ice was present in over 7,500 traffic accidents (more than 26% of total accidents). (Greg Monforton and Partners, 2020)
- In the year 2010, wet conditions, loose snow, or slush were present in nearly 3,500 traffic accidents (more than 12% of total accidents). (Greg Monforton and Partners, 2020)
- In 2019, 7,113 collisions (6.8% of all collisions) and 85 fatal collisions (5.2% of all fatal collisions) occurred while it was snowing. An additional 789 collisions (0.8% of all collisions) and 10 fatal collisions (0.6% of all fatal collisions occurred during freezing rain, sleet or hail. (Canada National Collision Database, November 2023)
- In the year 2020, heavy snow was falling during nearly 1,500 accidents, light snow was falling during more than 900 accidents, and sleet or hail was falling during more than 175 accidents. (Greg Monforton and Partners, 2020)
- A study of alcohol-related traffic crashes in Canada from 1 January 1995 to 1 January 2015 found that the risk that the crash would result in hospitalization increased by 19% in adverse weather. (“Adverse weather” included such conditions as rain, fog, snow, storms, and freezing rain, among other conditions.) (Redelmeier, Donald, and Mansoor, Fizza, January 2019)
- Weather-related vehicle accidents kill more people annually than large-scale weather disasters. (The Weather Channel, 2018)
- In the United States in 2007–2016, about 21% of all collisions involved adverse weather. An average of 5,376 persons per year were killed in weather-related crashes. In comparison, the average number of deaths per year from floods, lightning, tornadoes, hurricanes and heat combined was 379. (The Weather Channel, February 2022) In Canada in that same period, 18.4% of all collisions and an average of 374 fatalities per year (17.5% of all traffic fatalities) involved adverse weather, such as rain, snow, hail, sleet, freezing rain, strong winds, or other weather conditions that impeded visibility. (Canada National Collision Database, October 2023)
Child Safety Statistics
- From 2013 to 2019, there was an average of one child death per year in overheated parked cars in Canada. (SickKids, 2019)
- Extreme heat affects infants and small children more quickly and dramatically than adults because of their size. Children most at risk are aged 3 and younger. A study funded by General Motors of Canada found that on a day when daytime temperature was 35°C (95°F), the air temperature inside a previously air-conditioned small car exposed to the sun rose to 50°C (122°F) within 20 minutes. Within 40 minutes, the temperature soared to 65.5°C (150°F). Leaving a window slightly open did little to mitigate this. (Canada Safety Council, 2024)
- On a warm day, the temperature inside a car can exceed 65.5°C (150°F). 80% of the total increase in temperature happens in the first 30 minutes. A young child's body can overheat 3 to 5 times faster than an adult's body. Children have died of paediatric vehicular heatstroke even when the outside temperature was as low as 15.6°C (60°F). (Kids and Car Safety, accessed April 2025)
- If the exterior temperature is 20°C, an air-conditioned car’s interior temperature can soar to over 50°C within 20 minutes of shutting off the air conditioning. (Transport Canada, June 2023)
- Children under the age of 5 are at the highest risk for injury or death caused by a vehicle backing up over them. (KidsAndCars.org, 2018)
- Over 60% of backover accidents involve a truck or SUV. (KidsAndCars.org, 2018)
- In 1994–2003, there were 4,295 child pedestrian collisions reported to the Canadian Hospitals Injury Reporting and Prevention Program (CHIRPP). 148 (3.4%) of the collisions were backover collisions, of which 49 (33.1%) occurred in a driveway. (Unfortunately, we have not found more recent data on this issue; data on backover collisions in Canada is sparse.) (Nhan, Cindy et al., 2009)
- When installed and used properly, child car seats can reduce the risk of death by 71% for infants under one year of age. For children ages 4 and younger, child car seats reduce the risk of serious injury by 67%. For children of appropriate ages, booster seats provide 59% more protection than seat belts alone. (CAA, 2024)
General Driving-Related Injuries and Fatalities
- In Canada in 2020, the social costs of traffic collisions, including injuries and fatalities, totaled about $36 billion. This represented about 1.9% of Canada's Gross Domestic Product (GDP). (Transport Canada, January 2024)
- In Canada in 2023, there were 1,768 fatal collisions, the highest since 2014. In 2023, there were 1,964 motor vehicle fatalities, the most since 2013. There were 9,261 serious injuries resulting from traffic crashes, the most since 2019. (In this context, a “serious injury” is an injury requiring hospitalization for treatment or observation.) However, compared with 2004, fatal collisions were down by 27.5%, fatalities were down by 28.2%, and serious injuries were down by 40.5%. In 2023, there were 4.89 fatalities per 100,000 population, down from 8.58 fatalities per 100,000 population in 2004. (Transport Canada, May 2025)
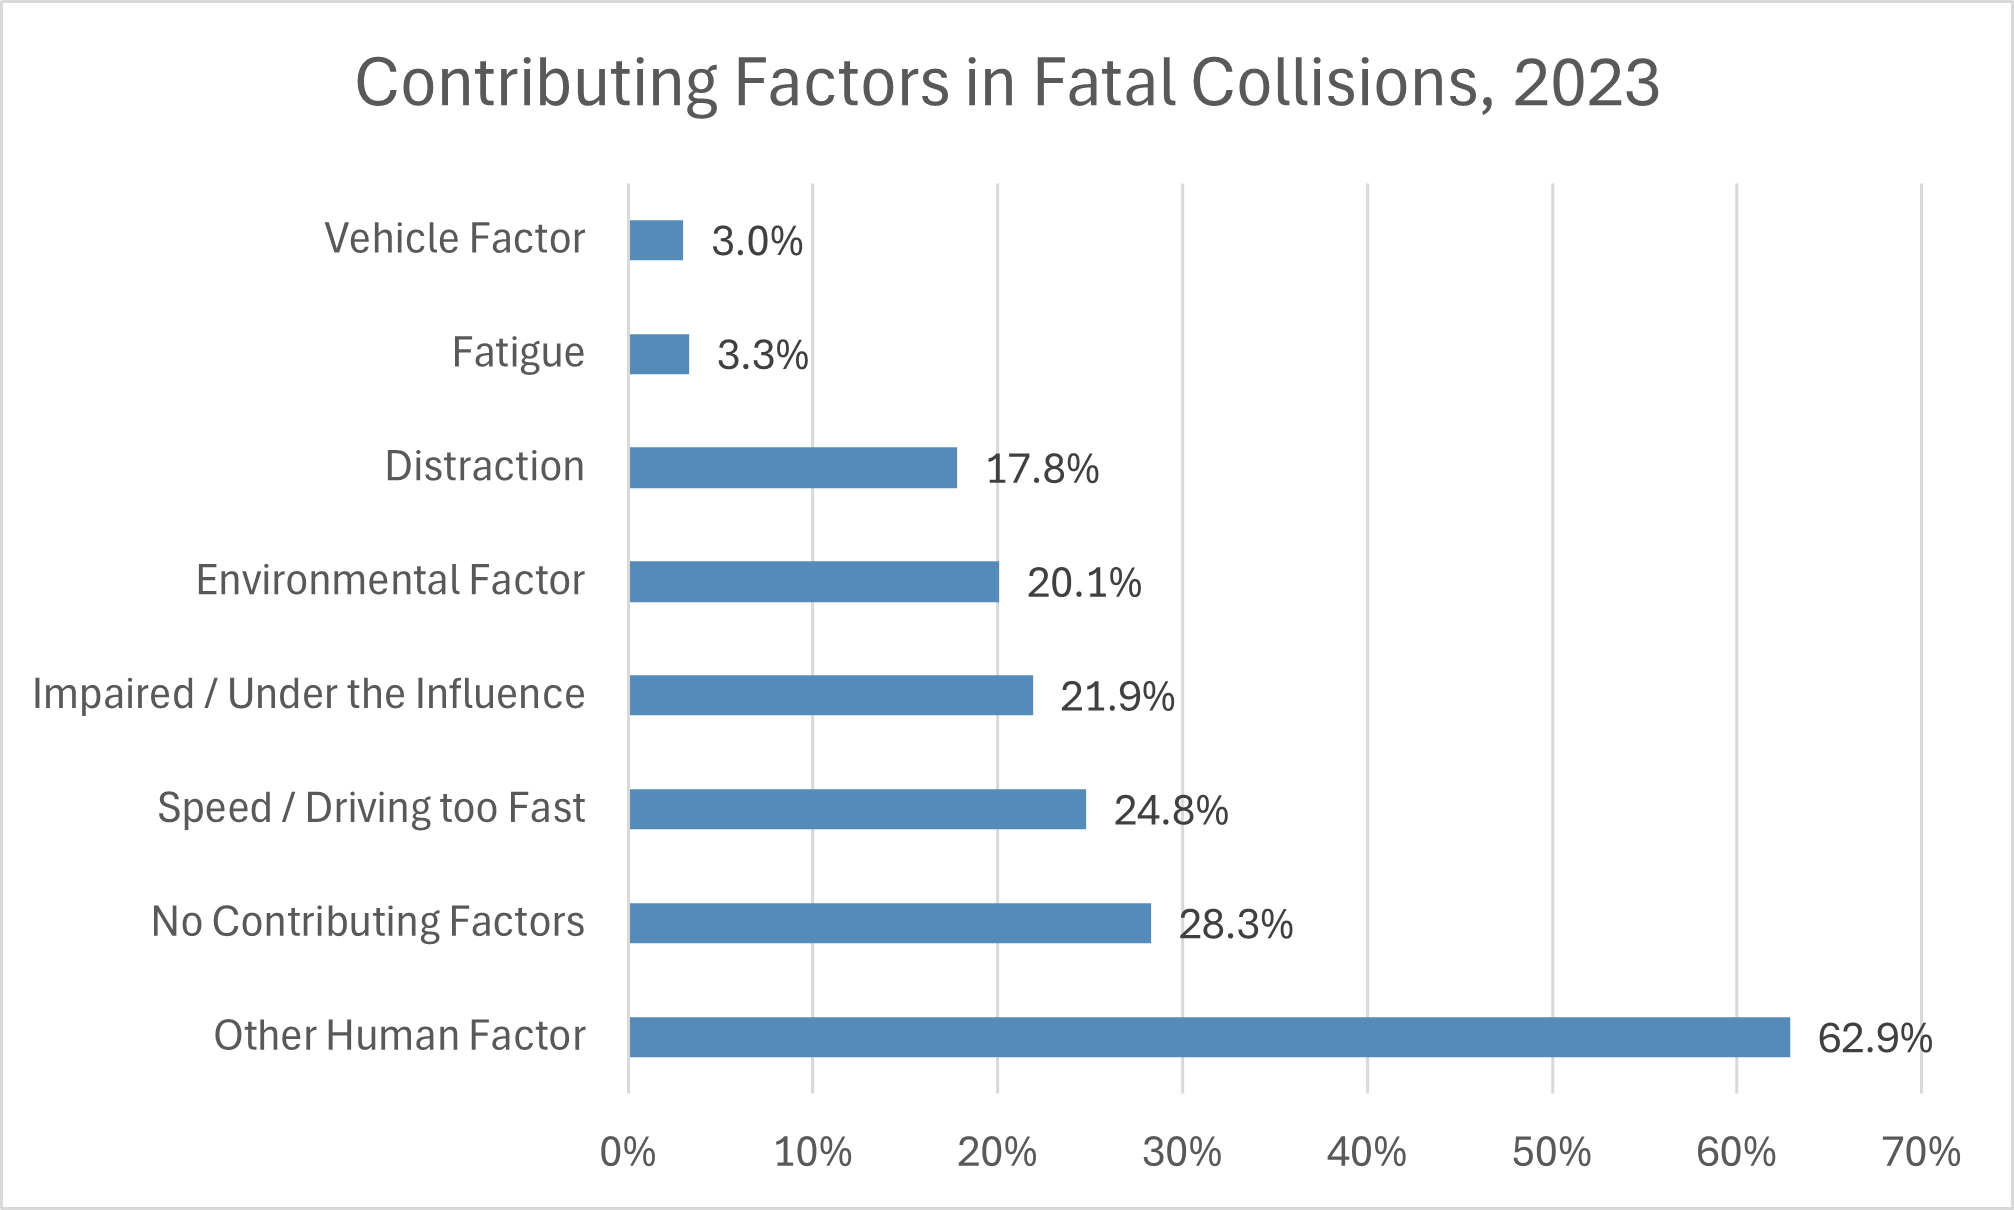
- In 2023, speeding or driving too fast for conditions was a contributing factor in 24.8% of fatal collisions, more than any other single identified contributing factor. Driving while impaired or under the influence was a contributing factor in 21.9% of fatal collisions. However, in 28.3% of fatal collisions that year, no contributing factors were identified. See the following chart. Note that the percentage of fatal collisions involving fatigue is likely an underestimate because of the difficulty of determining fatigue objectively. Also note that the sum of the values of the identified factors exceeded 100.0% because some collisions involved more than one contributing factor. (Transport Canada, May 2025)
Fatalities by Location
- Low- and middle-income countries have about 60% of the world’s vehicles but account for about 90% of the fatalities on the world’s roads. (WHO, accessed June 2025)
- In the European Union, there were about 20,600 road fatalities in 2022, which was 3% higher than in 2021 but 10% lower than in 2019. (European Commission, February 2023)
- In the European Union in 2022, Sweden had the lowest road fatality rate (22 road deaths per million inhabitants), and Romania had the highest rate (86 road deaths per million inhabitants). The EU average was 46 road deaths per million inhabitants. (European Commission, February 2023)
- In 2021, Canada had the lowest road fatalities (4.7) per 100,000 population of all countries in the Americas and the 29th lowest of all countries worldwide. (WHO, April 2024)
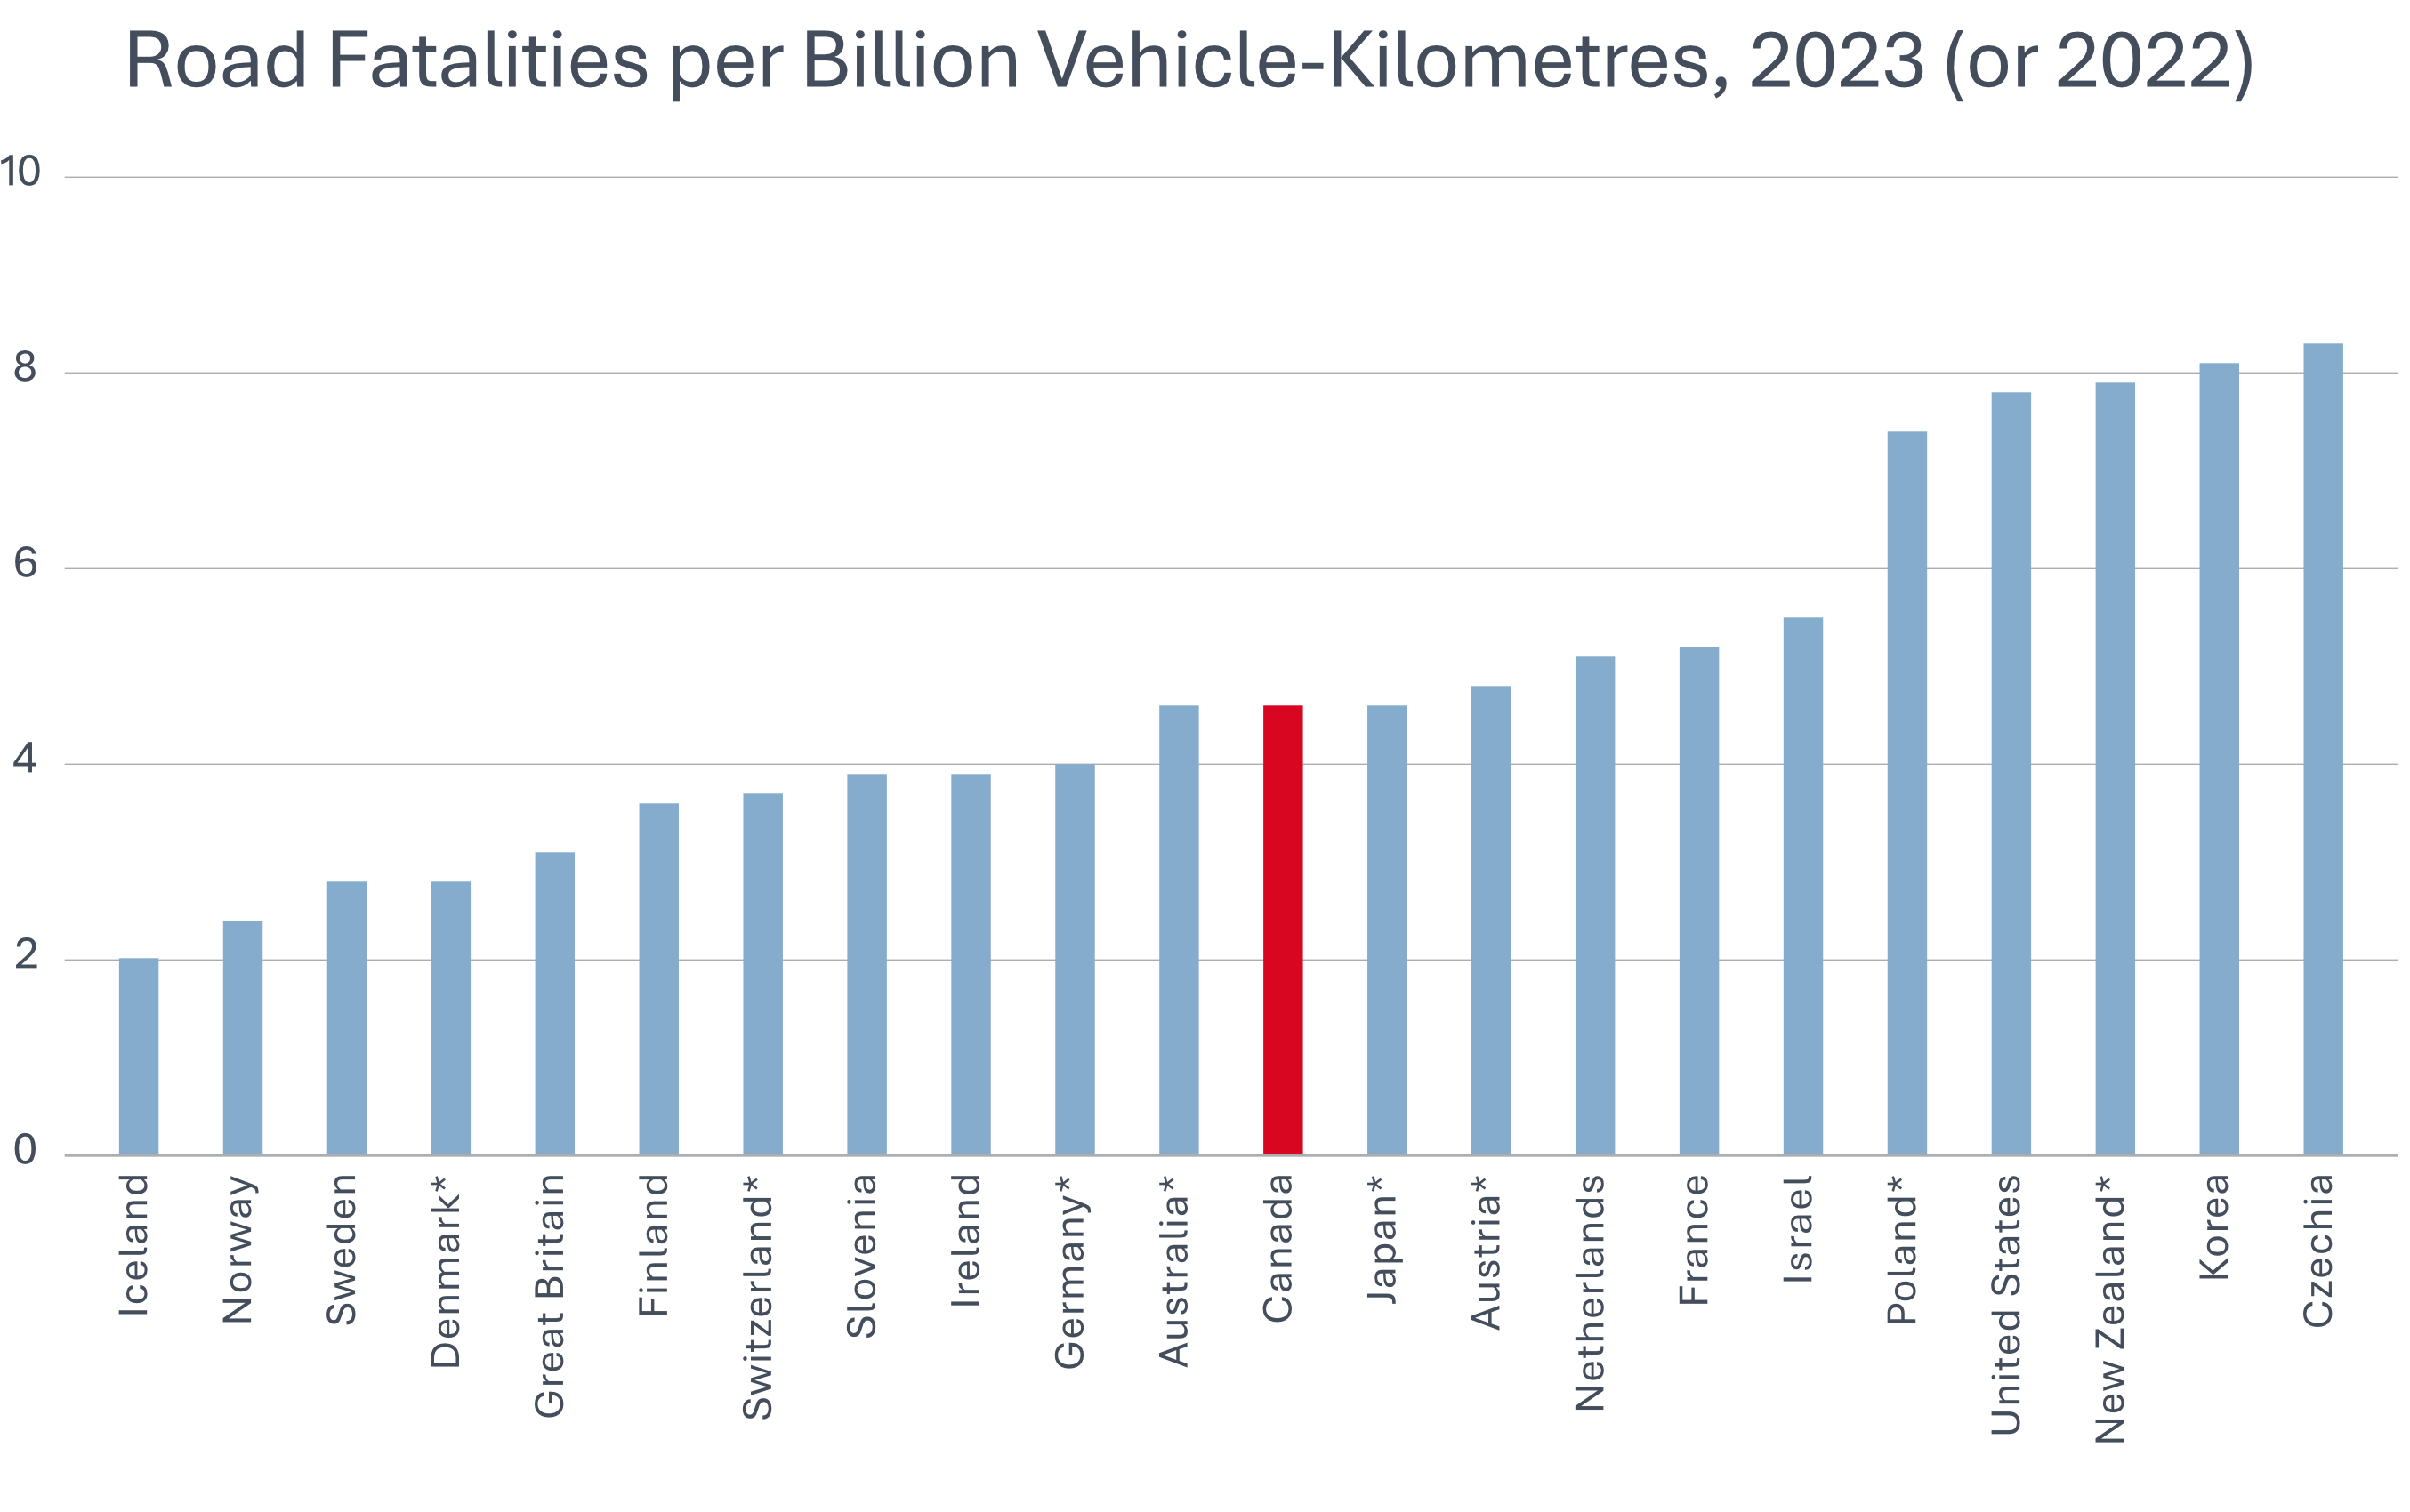
- In 2022 and 2023, road fatalities per billion vehicle-kilometres travelled were lower in Canada than in many other developed countries, such as France and the Netherlands, and much lower than in the United States. The following chart contains mostly 2023 data for various countries, with two exceptions: (1) For the United Kingdom, only 2023 data from Great Britain is shown. (2) For countries with an asterisk, only 2022 data is shown. (International Transport Forum, 2024)
- In Canada in 2023, there were 1,768 fatal collisions, the highest since 2014. In 2023, there were 1,964 motor vehicle fatalities, the most since 2013. There were 9,261 serious injuries resulting from traffic crashes, the most since 2019. (In this context, a “serious injury” is an injury requiring hospitalization for treatment or observation.) However, compared with 2004, fatal collisions are down by 27.5%, fatalities are down by 28.2%, and serious injuries are down by 40.5%. In 2023, there were 4.89 fatalities per 100,000 population, down from 8.58 fatalities per 100,000 population in 2004. (Transport Canada, May 2025)
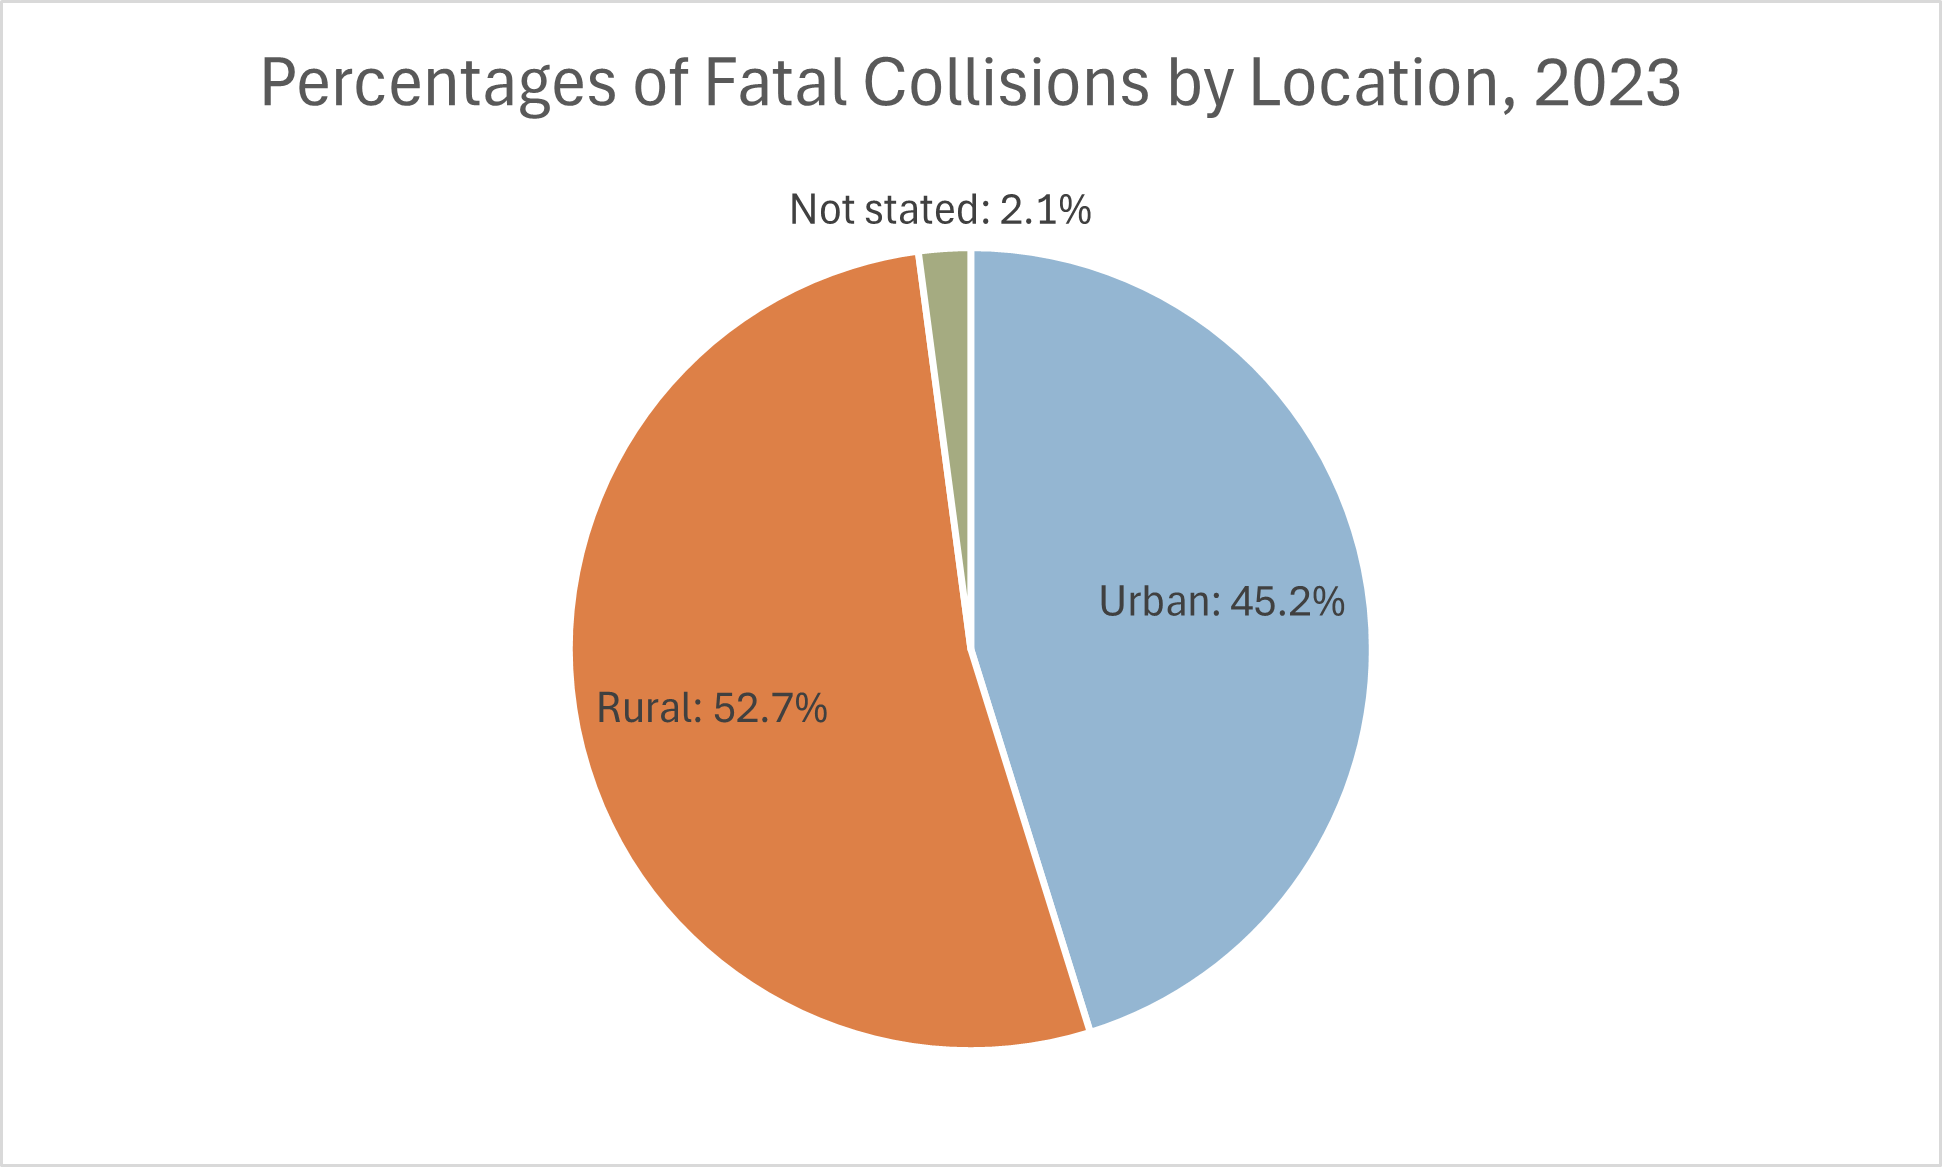
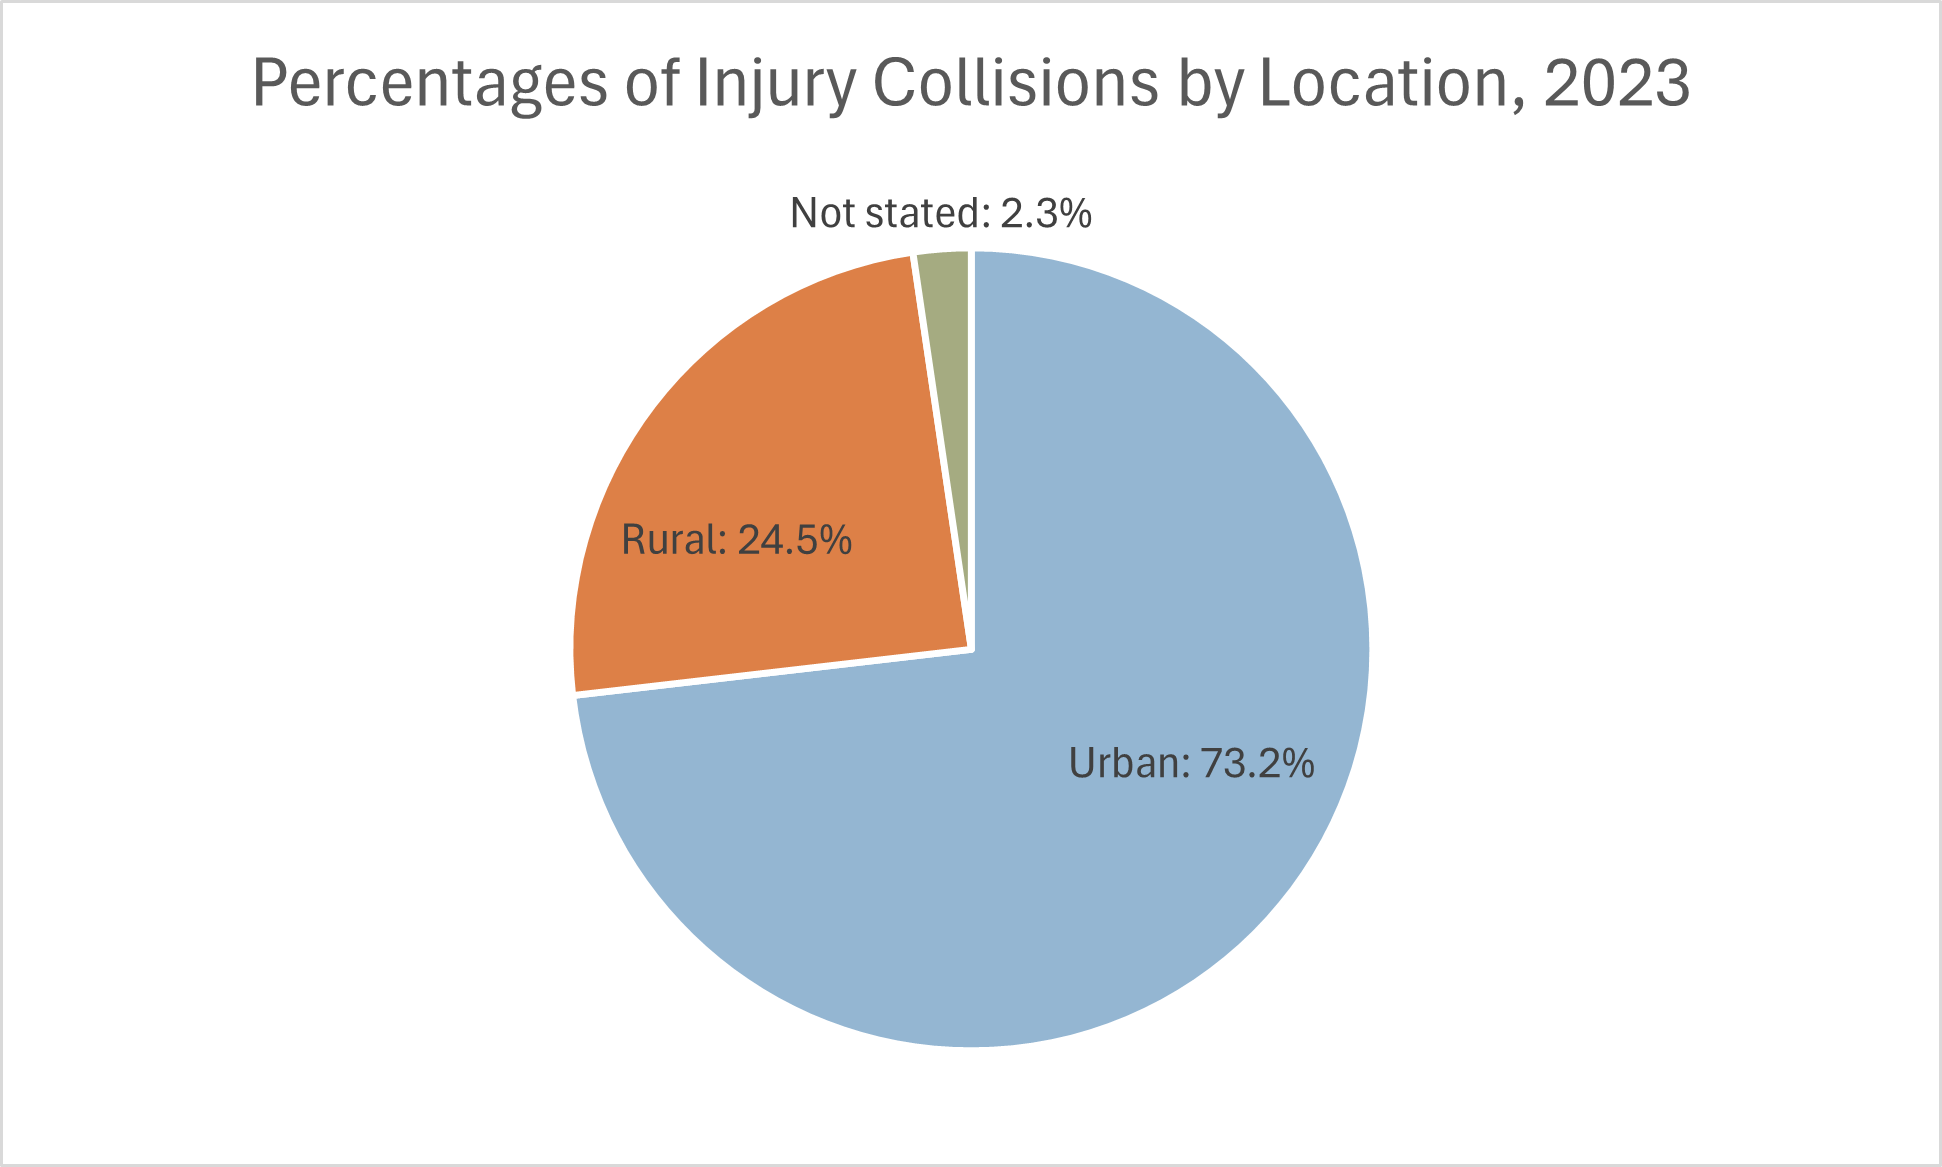
- In Canada in 2023, the percentages of fatal collisions and injury collisions by location (urban vs. rural) were as shown in the following two charts. (Note: In this context, the definitions of “urban” and “rural” differ from the usual dictionary definitions. “Urban” roads also include all roads whose speed limit is 60 km/h or less; “rural” roads also include all roads whose speed limit exceeds 60 km/h. Furthermore, in Alberta, New Brunswick, Manitoba, and Saskatchewan, "urban" includes any area within the corporate boundaries of a city, town, village or hamlet. "Rural" includes any area outside of what is defined as “urban.” (Transport Canada, May 2025)
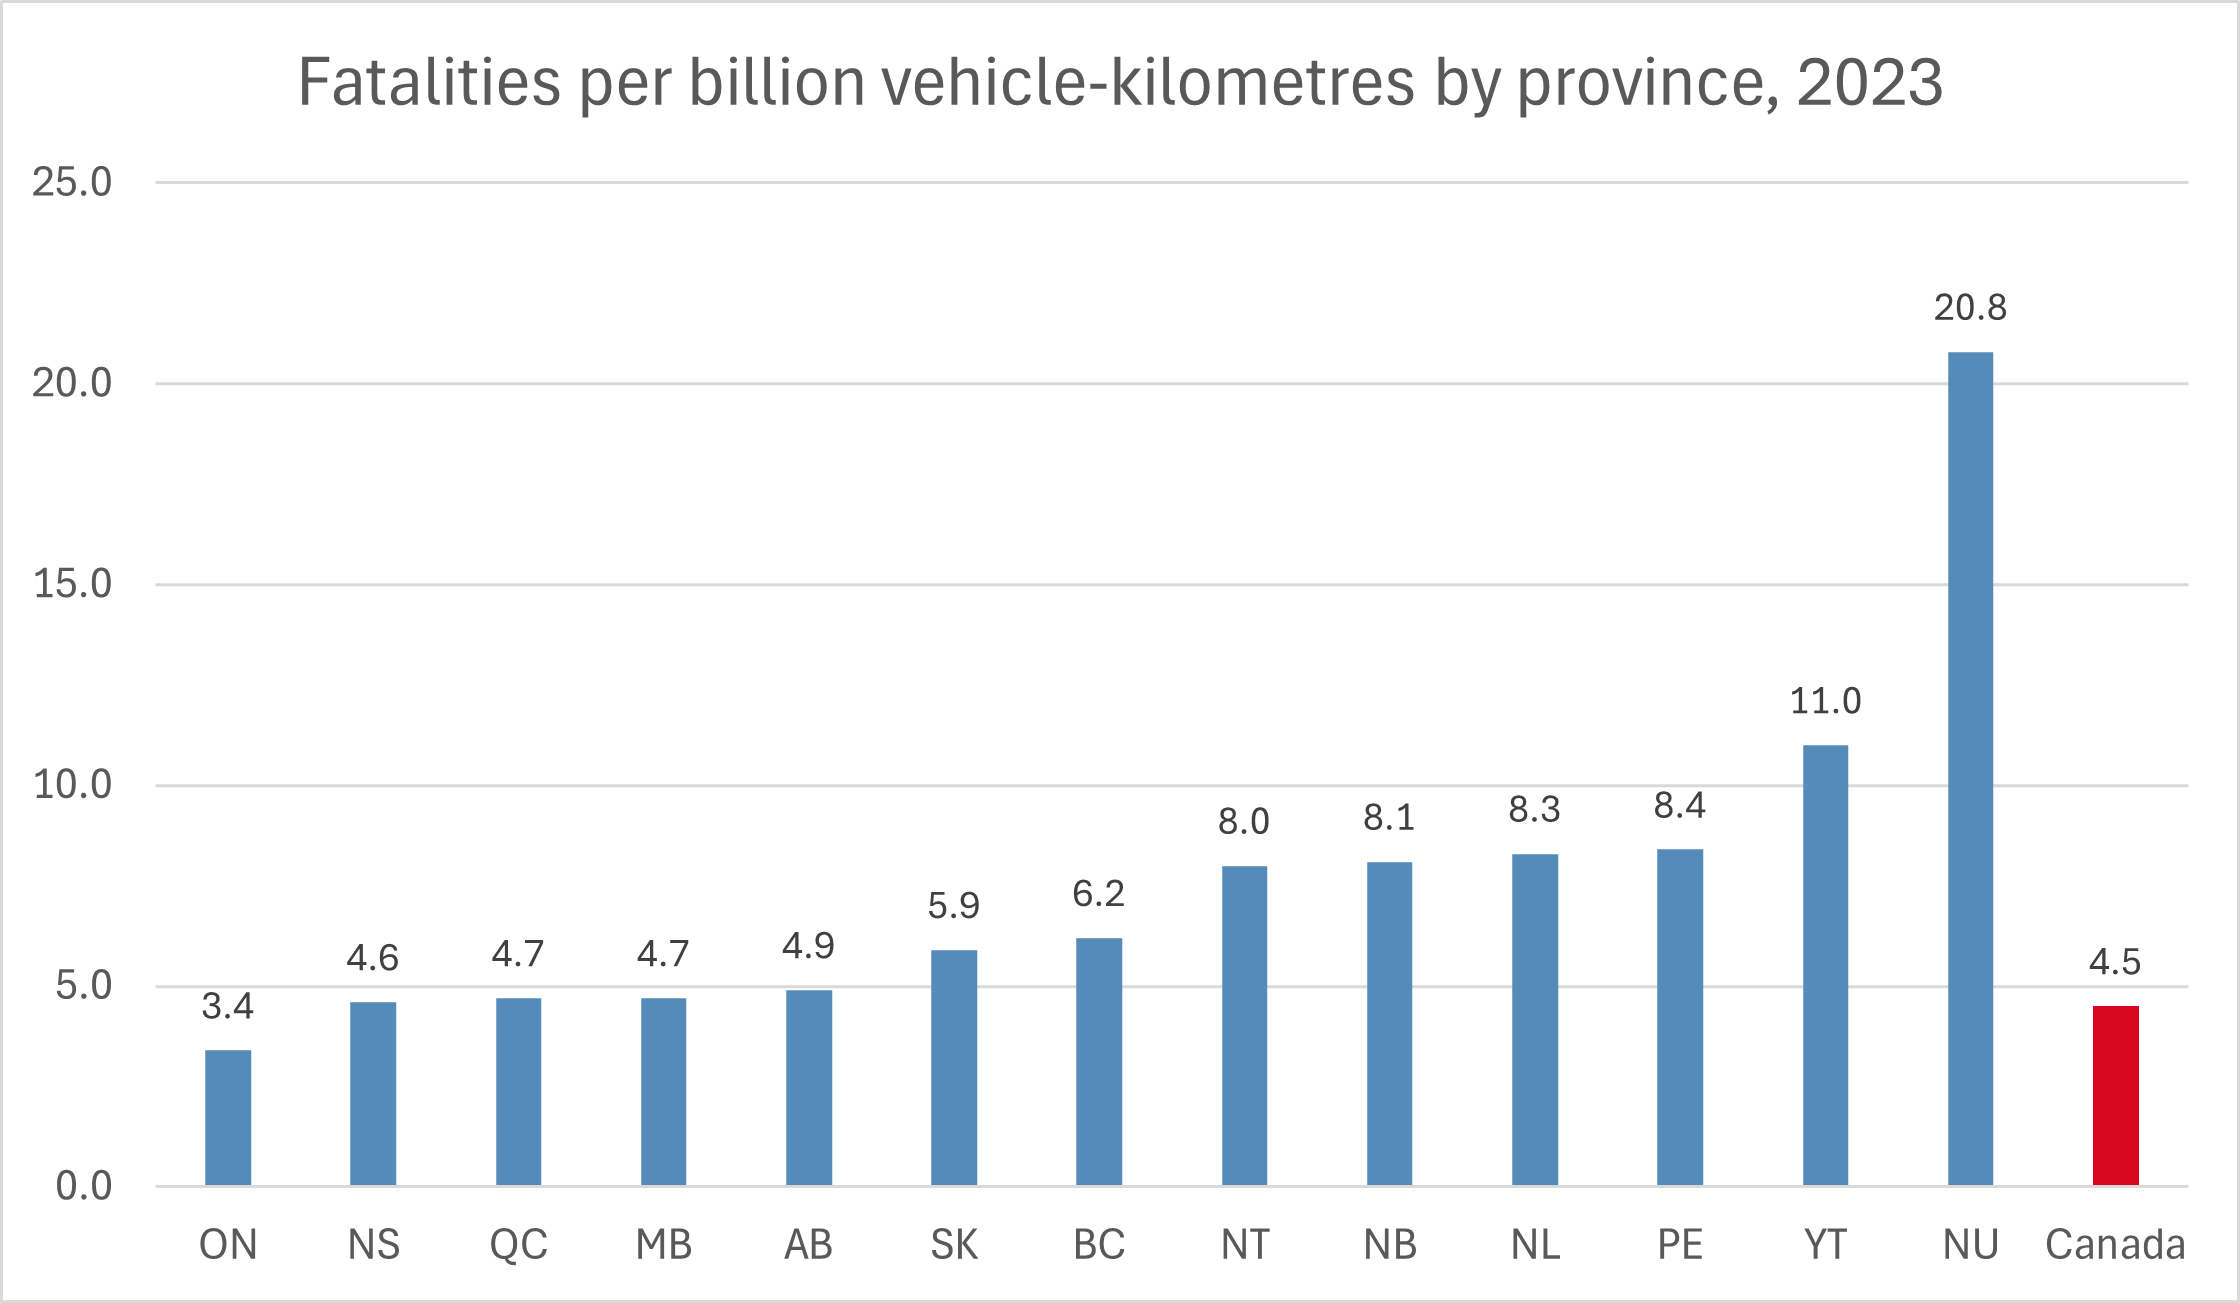
- Among all Canadian provinces and territories in 2023, Nunavut had the highest rate of traffic fatalities (20.8) per billion vehicle-kilometres travelled. Ontario had the lowest rate: 3.4 fatalities per billion vehicle-kilometres. The Yukon had the highest rate by far (19.8) of fatalities per 100,000 population. Nunavut had the lowest rate (2.5) per 100,000 population. The Yukon had the highest rate by far (20.8) of fatalities per 100,000 licensed drivers. Ontario had the lowest rate (5.3) per 100,000 licensed drivers. Note, however, that rates in less populous jurisdictions tend to fluctuate a great deal from year to year because of their small sample size. See the following chart. (Transport Canada, May 2025)
- Unfortunately, national data on work zone accidents is lacking. However, here are some data from individual provinces:
- In Alberta, approximately 70 work zones recorded at least one traffic-related injury every day. (University of Alberta, February 2022)
- In British Columbia, motor vehicle collisions are the leading cause of work-related fatalities. An average of 24 workers are killed each year. (WorkSafeBC, March 2013)
- In 2013 in Ontario, there were 1,694 collisions in construction zones. Seven of these collisions led to the deaths of eight people, and another 341 of these collisions involved injuries. (Ontario Ministry of Transportation, 2013)
- In 2022, there were 821 work zone fatal crashes with 891 work zone crash fatalities in the United States. These 891 work zone fatalities included 742 drivers and passengers, 136 pedestrians, and 9 bicyclists. Surprisingly, according to the official figures, 105 (77%) of these 136 pedestrian fatalities were not workers in the work zones. However, these numbers may partly depend on the criteria for classifying pedestrians as roadside workers. Some other estimates place the percentage of roadside worker fatalities at up to 38% of all work zone pedestrian fatalities. Still, even this higher figure would mean that just 6% of total work zone fatalities were the roadside workers themselves in 2022. (FHWA, April 2024; National Work Zone Safety Information Clearinghouse, 2025)
Fatalities by Class of Road User
- More than half of all road traffic deaths worldwide occur among pedestrians, cyclists, and motorcyclists. Worldwide, road traffic injuries are the leading cause of death for children and young adults aged 5–29, yet two-thirds of road traffic fatalities occur among people aged 18–59. Males are three times as likely to be killed as females. (WHO, 2023)
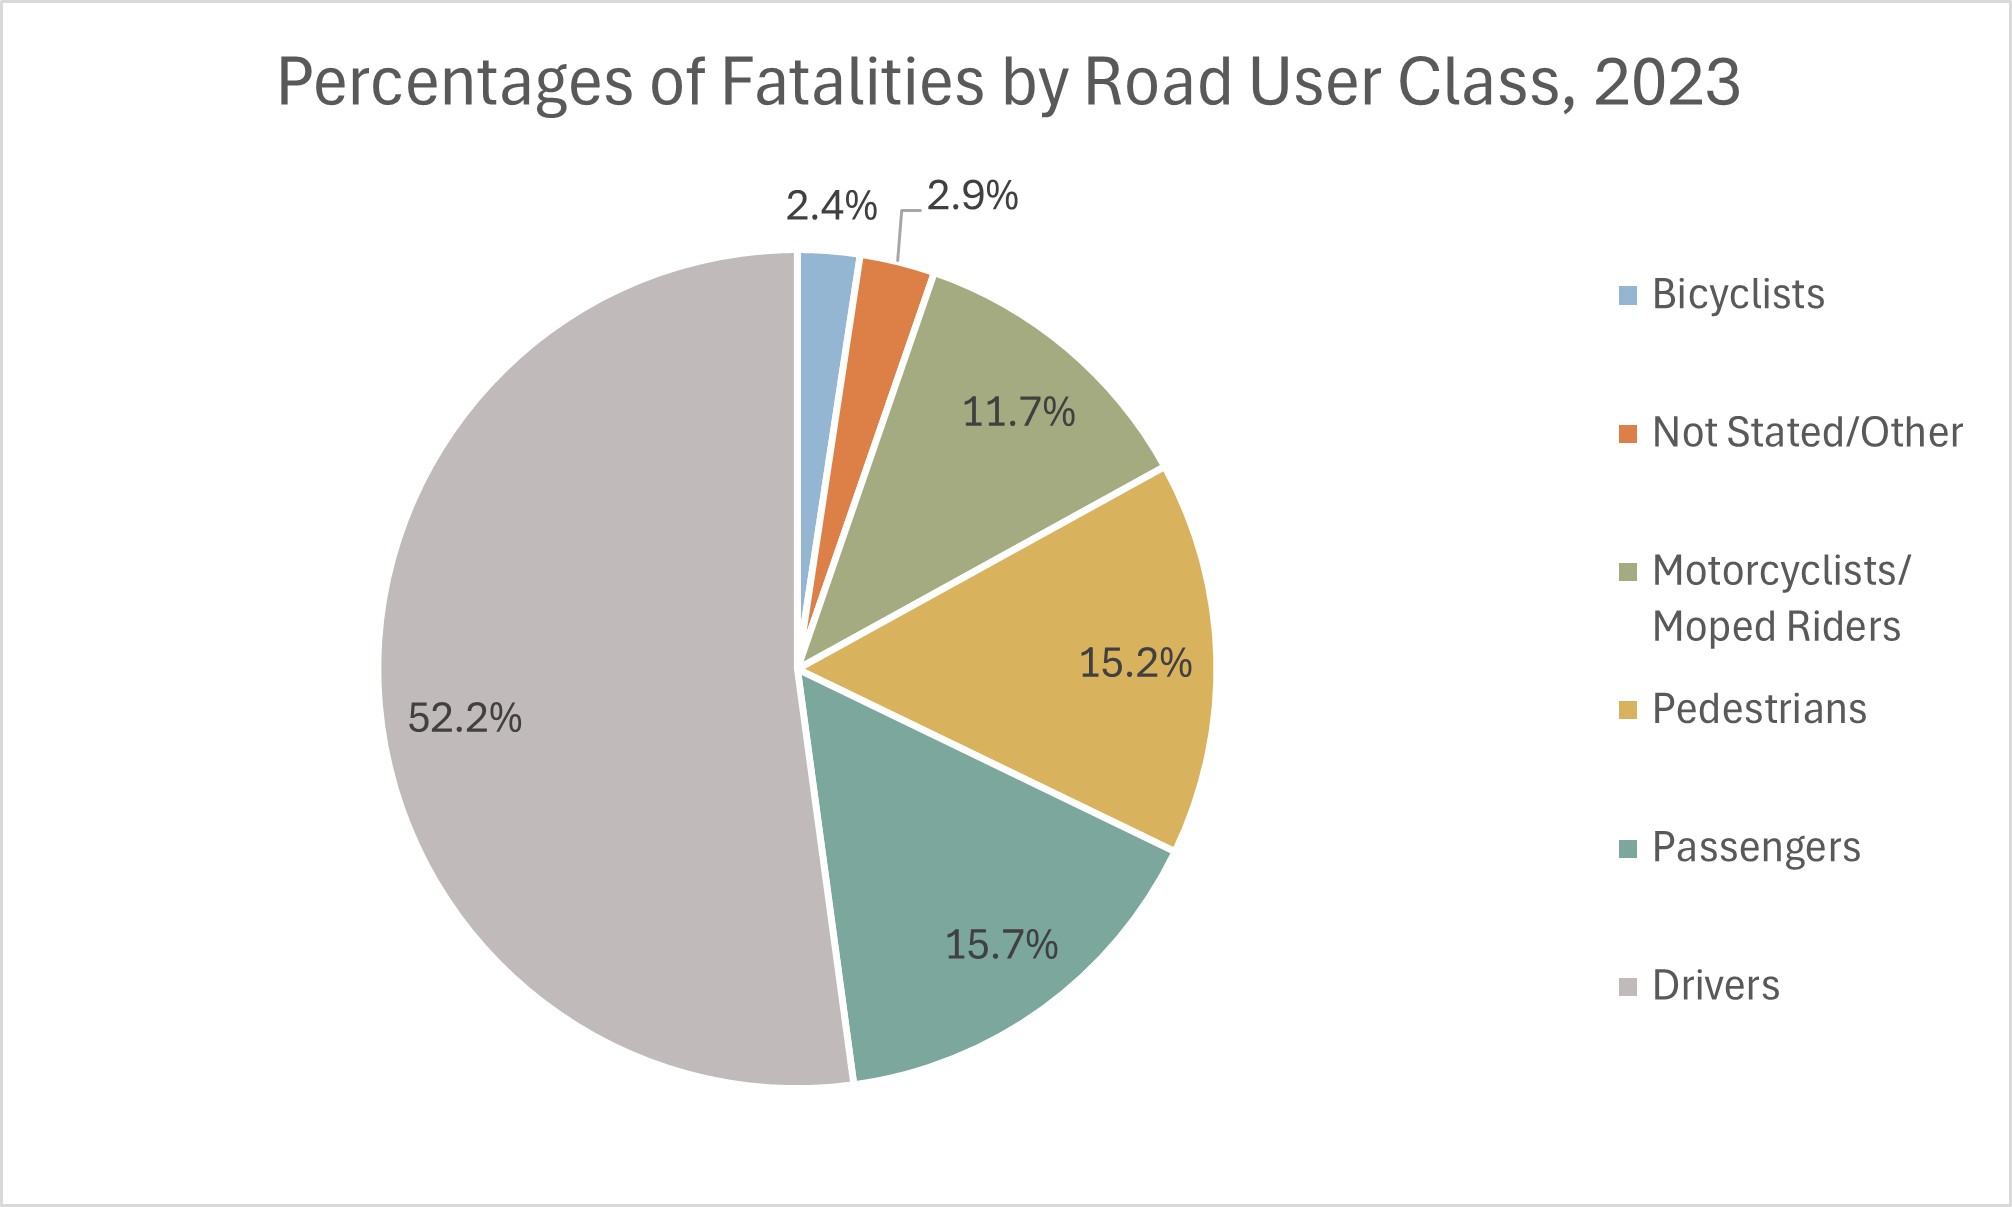
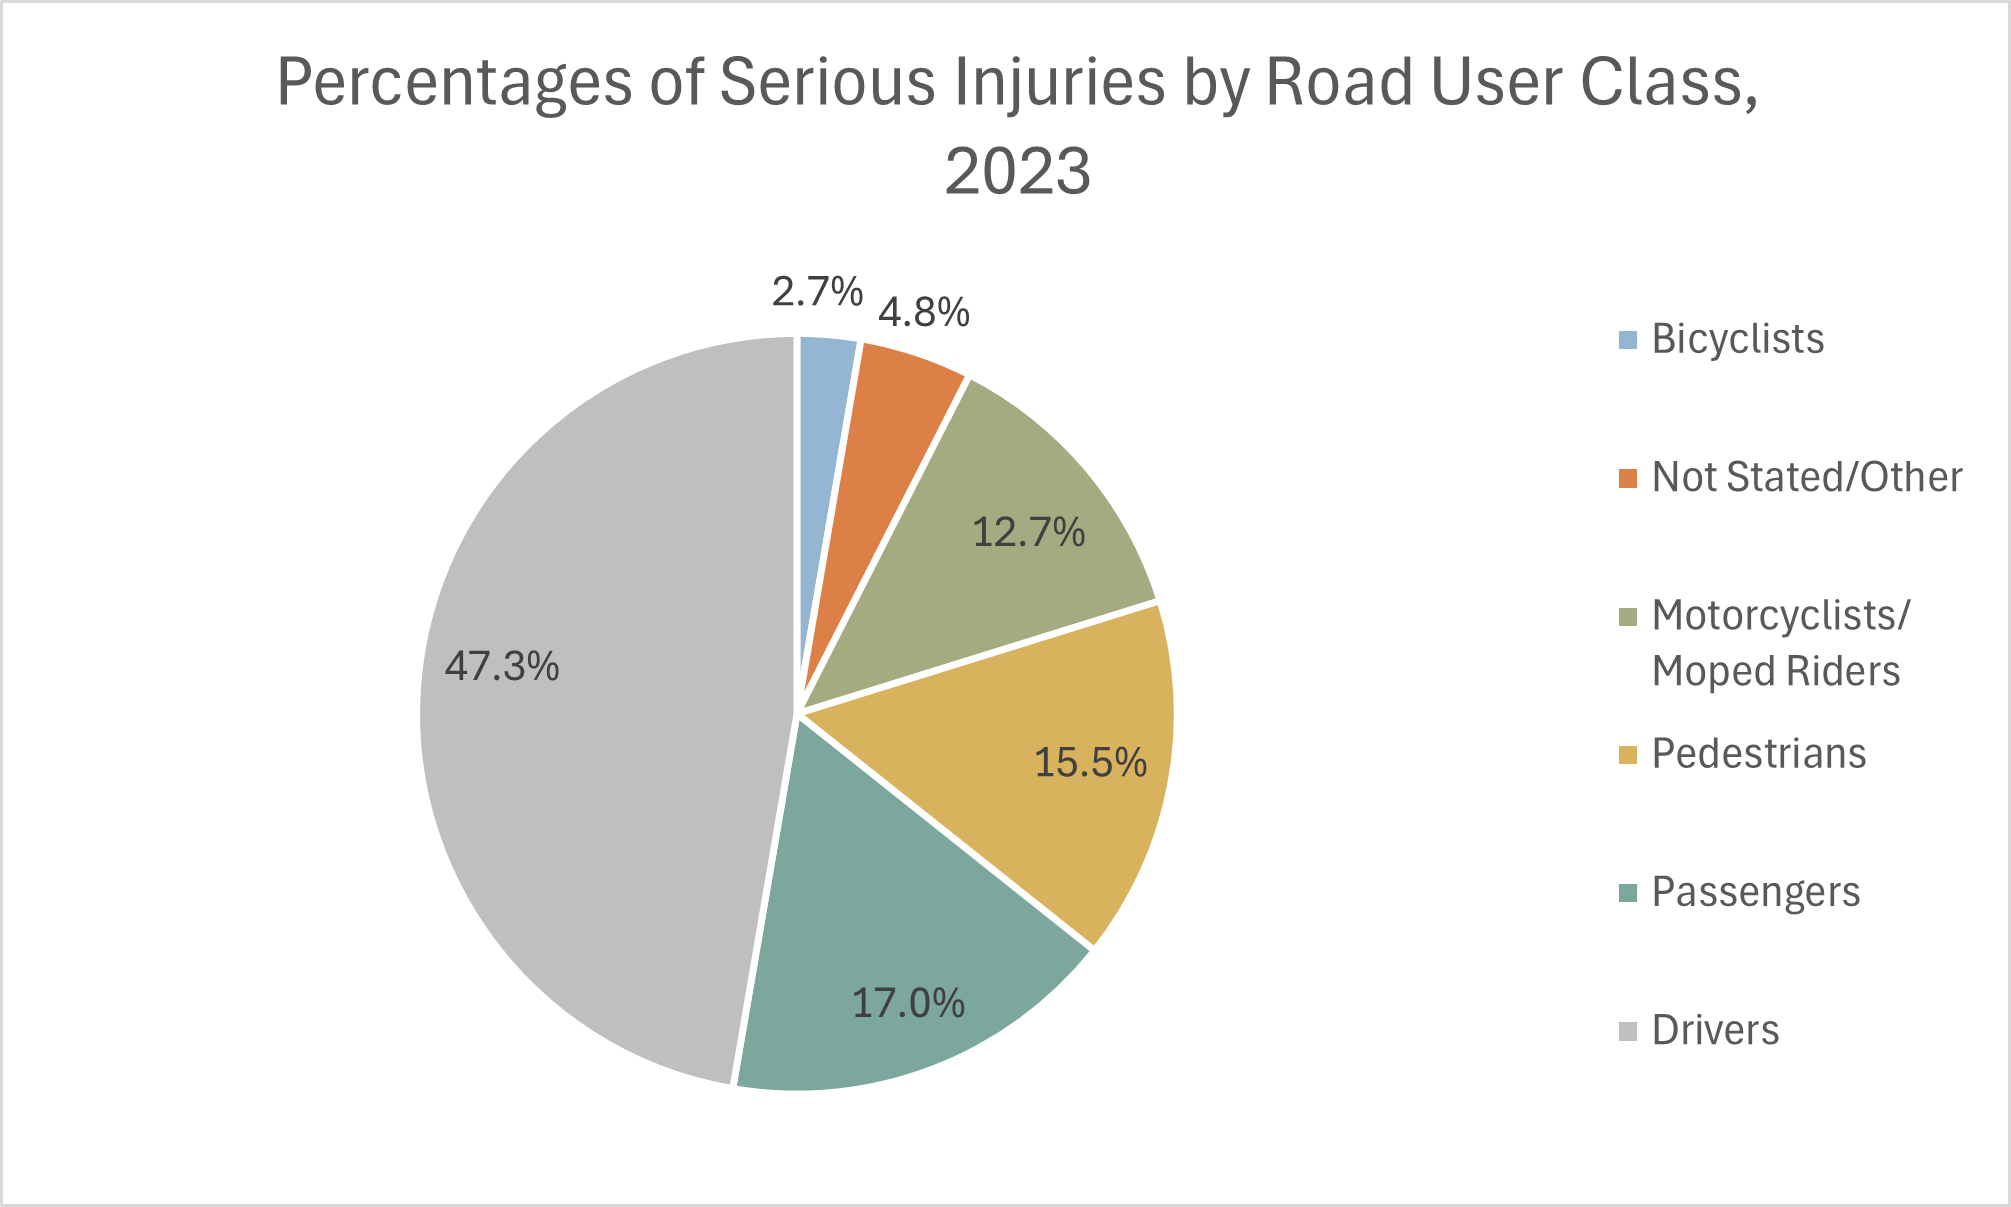
- In 2023, 52.2% of fatalities and 47.3% of seriously injured persons in road collisions in Canada were the drivers themselves. (In this context, a “serious injury” is one requiring hospitalization for treatment or observation.) The second largest category of injured road users was passengers, comprising 15.7% of fatalities and 17.0% of serious injuries. As noted in the section Driver Demographics, motorcycles and mopeds made up just 3.2% of Canada’s registered vehicles, yet they accounted for 11.7% of fatalities and 12.7% of serious injuries. See the following two charts. (Transport Canada, May 2025)
- It is estimated that in Canada, motorcyclists are 15 times as likely to be involved in a crash as car drivers are. Motorcyclists are 13.5 times as likely to be killed in a crash as car drivers are. (FortNine.ca, 2018)
- During 2016 – 2020, there was an average of 211 motorcycle fatalities each year. The three most common types of fatal motorcycle collisions combined accounted for more than half of all motorcycle fatalities: collision with a stationary object or running off the road (27%), left-turn collision or right-angle (T-bone) collision (25%), and head-on collision (10%). (Statistics Canada, May 2023; Canada National Collision Database, October 2023)
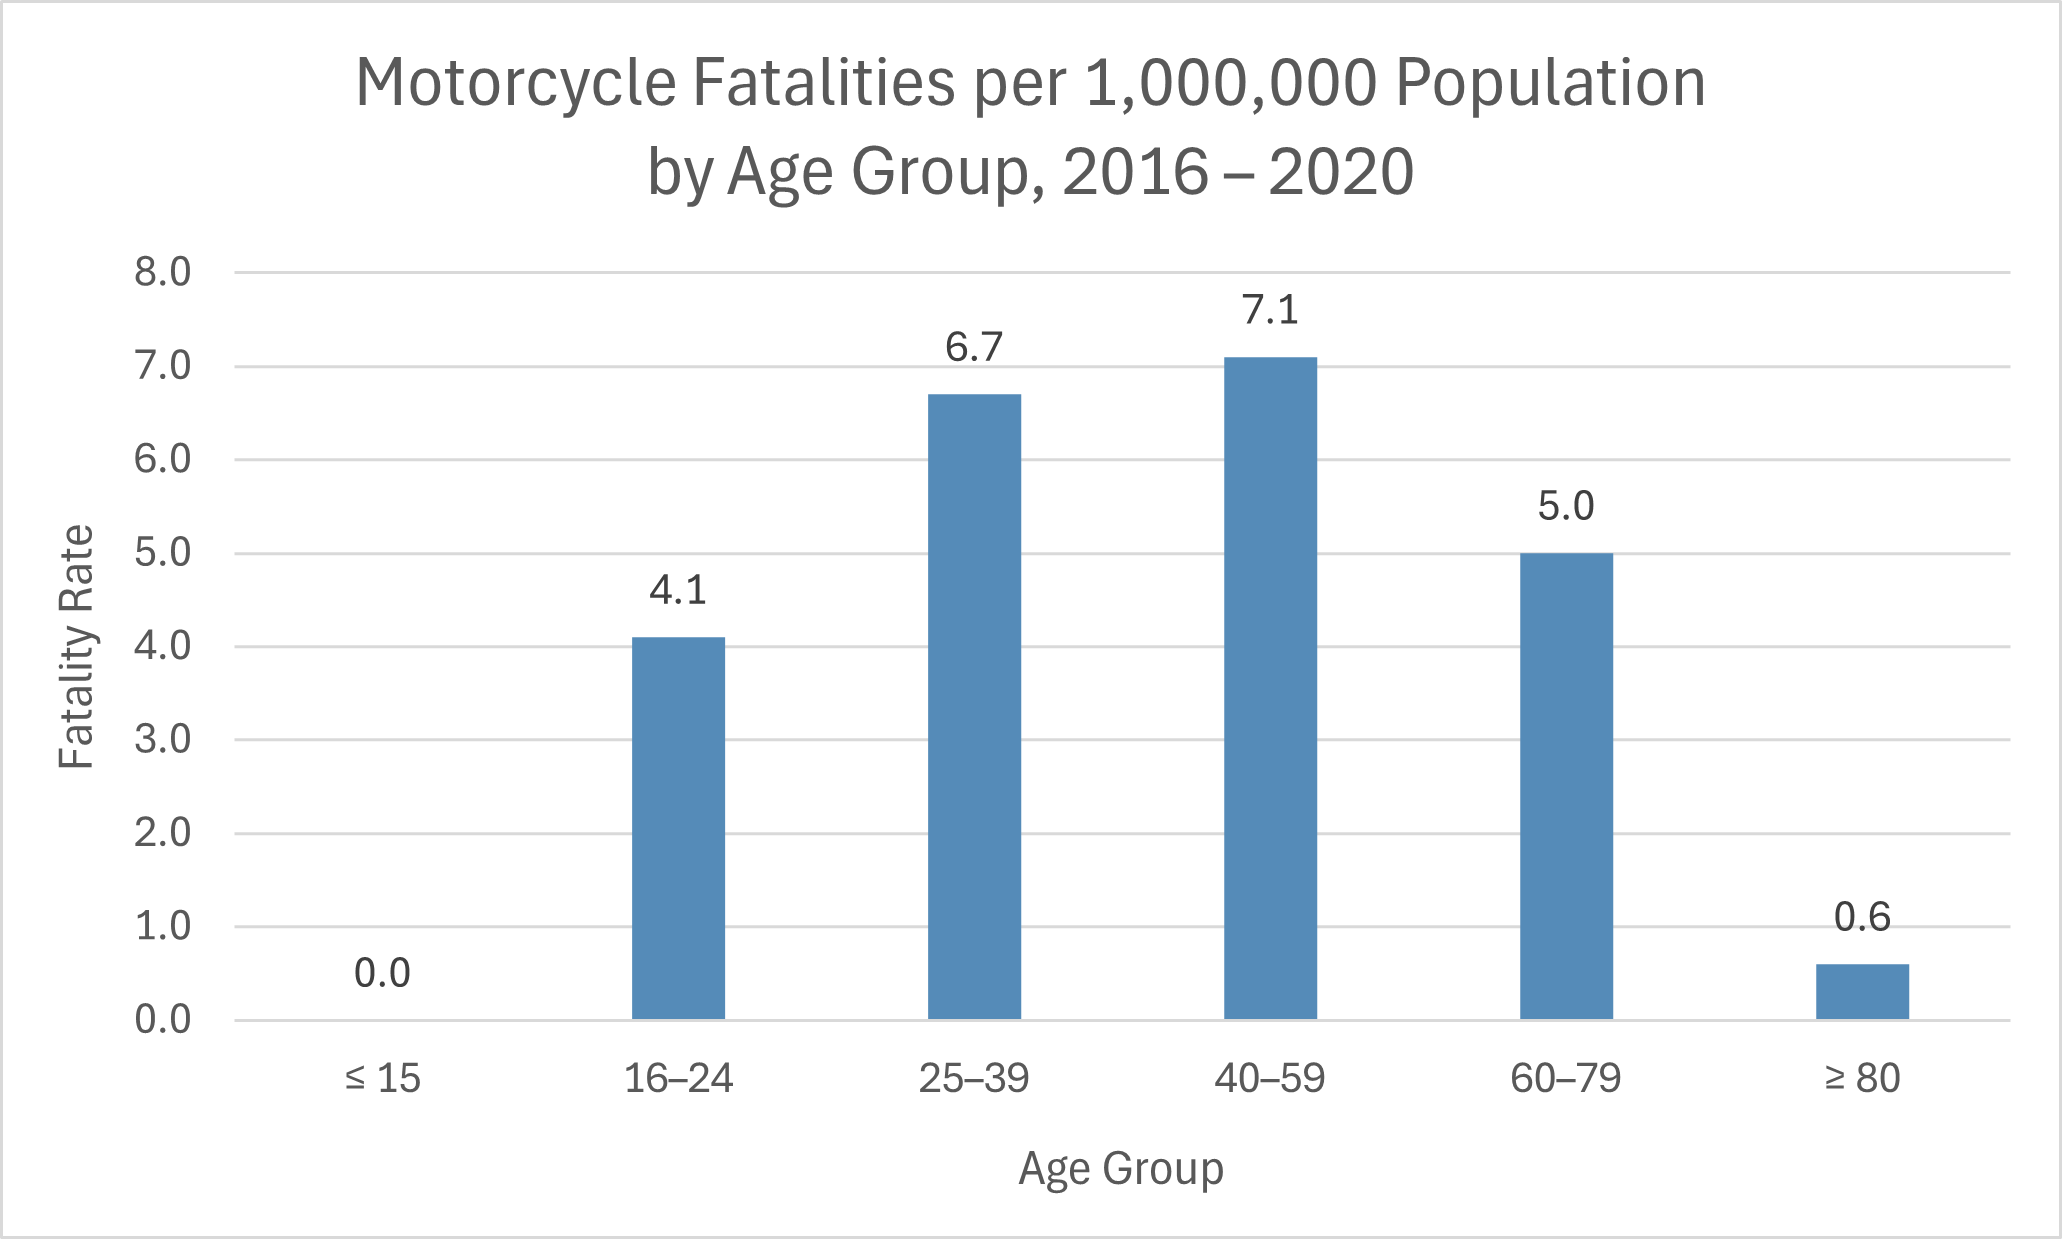
- In 2016 – 2020, there were about 7.1 motorcycle fatalities aged 40–59 per one million population, the highest death rate for all age groups. See the following chart. (Statistics Canada, May 2023)
- During 2016 – 2020, the three most common risk factors for motorcycle fatalities were consumption of alcohol or drugs (31%), losing control of the motorcycle (27%), and speeding (24%). Over half of motorcycle fatalities involved at least one risk factor. (Statistics Canada, May 2023)
- During 2016 – 2020, 12% of motorcycle riders who were killed were riding with a passenger at the time. However, the riders (motorcycle operators) accounted for 84% of motorcycle fatalities. (Statistics Canada, May 2023)
- During 2016 – 2020, there were 8.5 traffic deaths of male motorcycle riders per one million population. For female riders, there were 1.1 deaths per one million population. (Statistics Canada, May 2023)
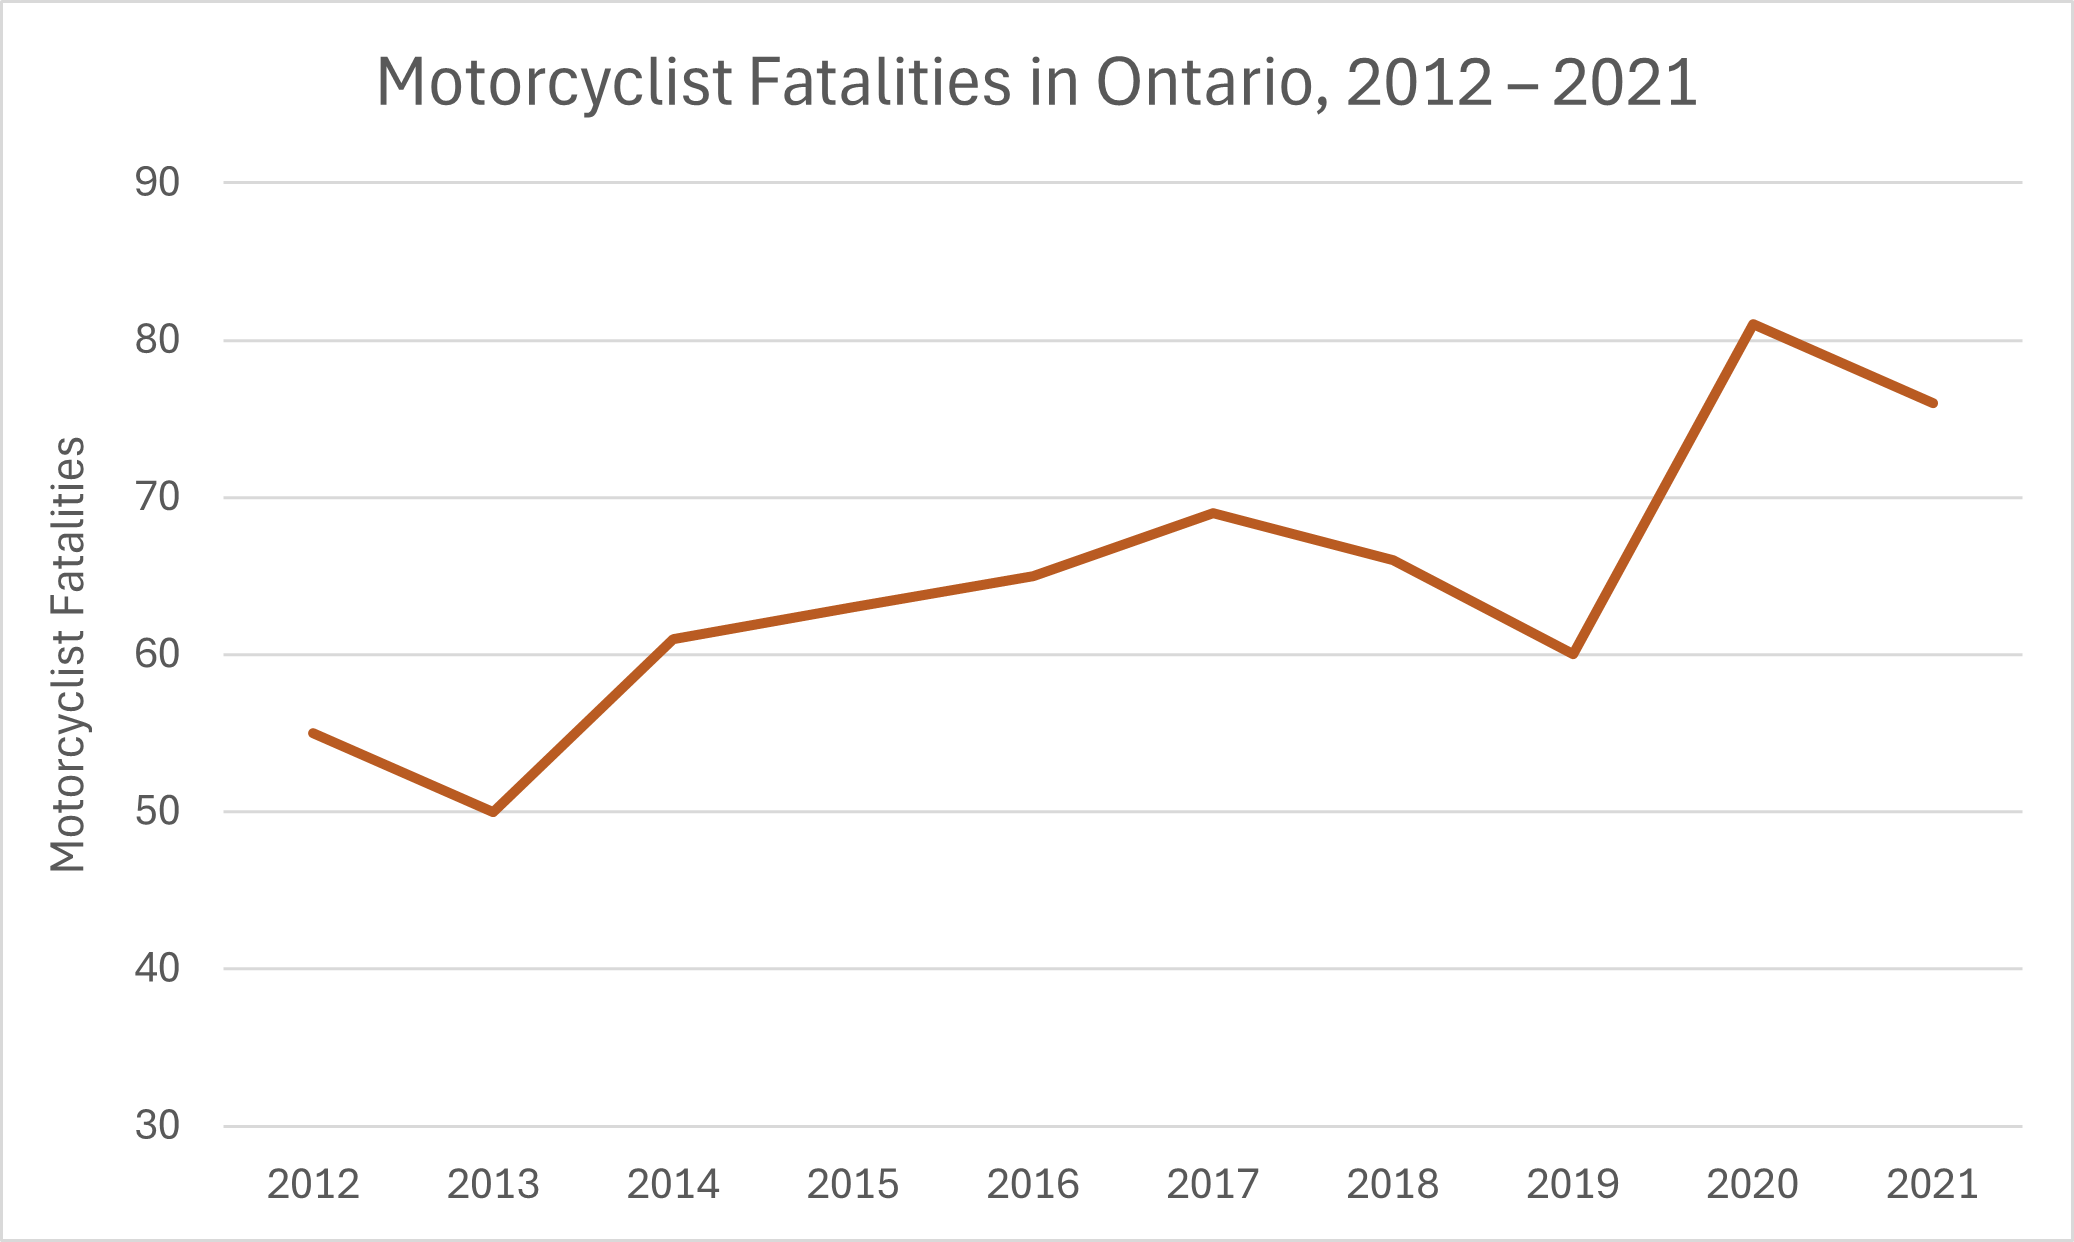
- In 2021, there were 561 road fatalities in Ontario, including 76 motorcyclists (14% of total fatalities). (In this context, “motorcyclists” include motorcycle drivers and motorcycle passengers.) 2021 is the most recent year for which final figures are available from Ontario. In comparison, there were 55 motorcyclists killed in 2012. See the following chart. (Ontario Ministry of Transportation, July 2024)
- In 2023, there was a total of 1,964 road fatalities in Canada, of which 399 (20.3%) involved a commercial motor vehicle (CMV), such as a truck or bus. Most of the fatalities in CMV collisions were not occupants of the CMVs. 216 (54.1%) fatalities were occupants of passenger vehicles (e.g., cars) involved in the collisions. 67 (16.8%) fatalities were occupants of the CMVs. 53 (13.3%) fatalities were pedestrians. (Transport Canada, May 2025)
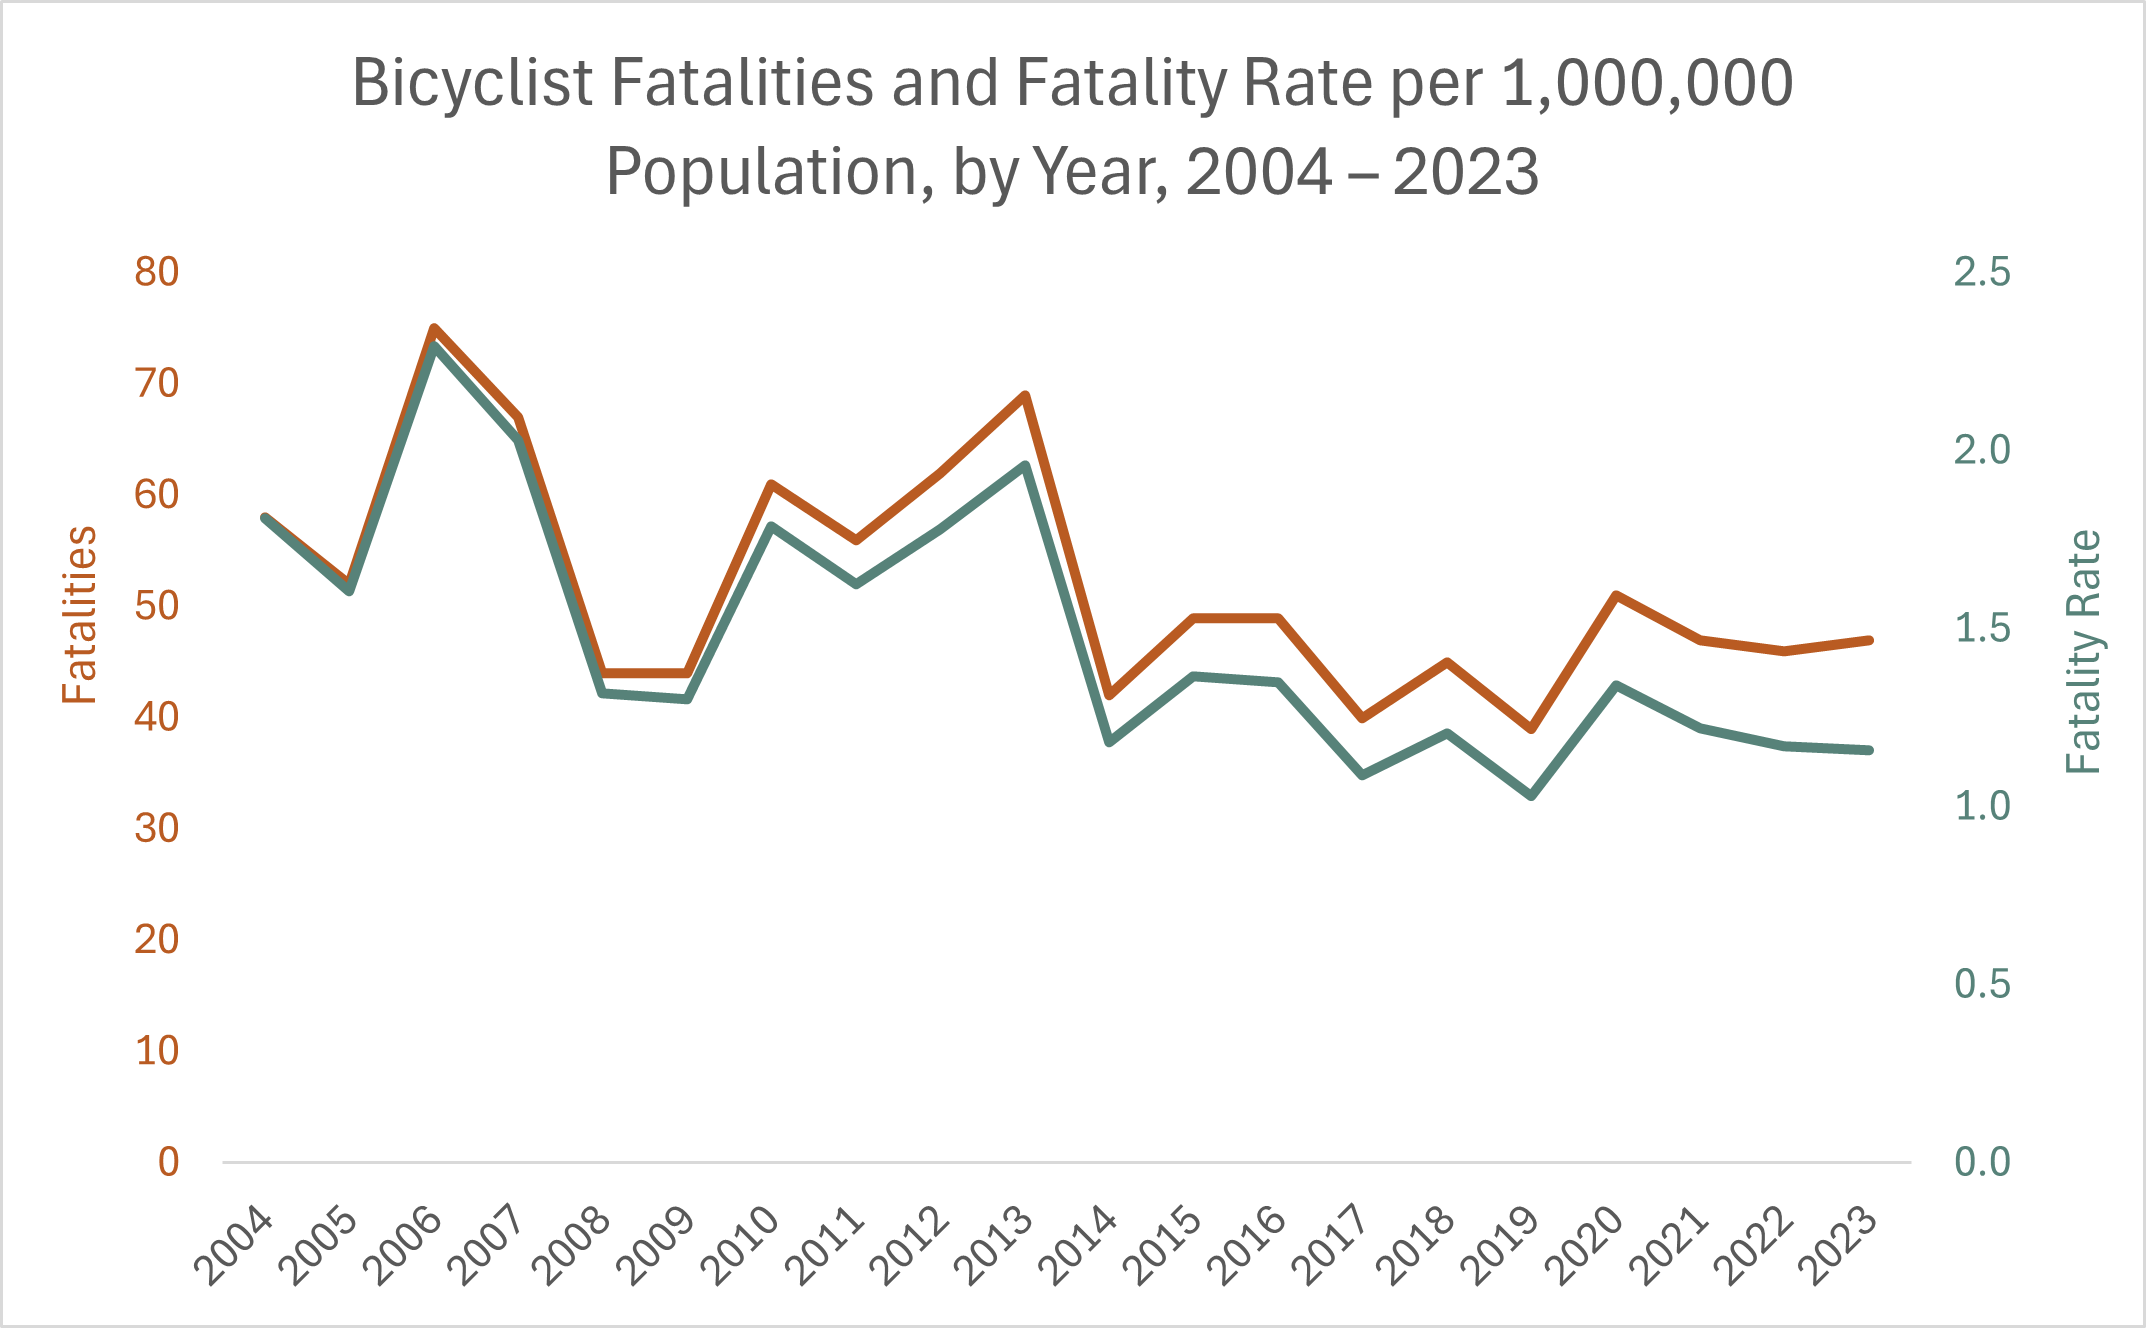
- The number of bicyclists killed per year declined from 58 in 2004 to 47 in 2023. This downtrend was even more pronounced in terms of the rate of bicyclist fatalities per one million population, as Canada’s population increased during this period. See the following chart. (Canada National Collision Database, October 2023; Transport Canada, May 2025)
- From 2002 through 2021, a total of 1,058 bicyclists were killed on Canada’s roads. 863 (81.6%) of these bicyclist fatalities were male; 187 (17.7%) were female. (Canada National Collision Database, October 2023)
- About 7,500 cyclists are seriously injured each year. (CAA, 2020)
- 18% of cyclists who were killed in crashes were under the age of 16. (CAA, 2020)
- 19% of cyclists who were killed in crashes were struck by a heavy truck. (CAA, 2020)
- Most bicycle crashes and injuries occur during the afternoon rush hour. However, 34% of cyclists who were killed in crashes had been struck by a vehicle in the dark. (CAA, 2020)
- 64% of cyclist deaths from traffic crashes occurred on city roads (those with a speed limit of up to 70 km/h). The remainder occurred on rural roads (with a speed limit of 80 km/h or higher). (CAA, 2020)
- From 2004 through 2023, an average of 322 pedestrians were killed each year in traffic collisions in Canada. In 2023, 298 pedestrians were killed. (Canada National Collision Database, October 2023; Transport Canada, May 2025)
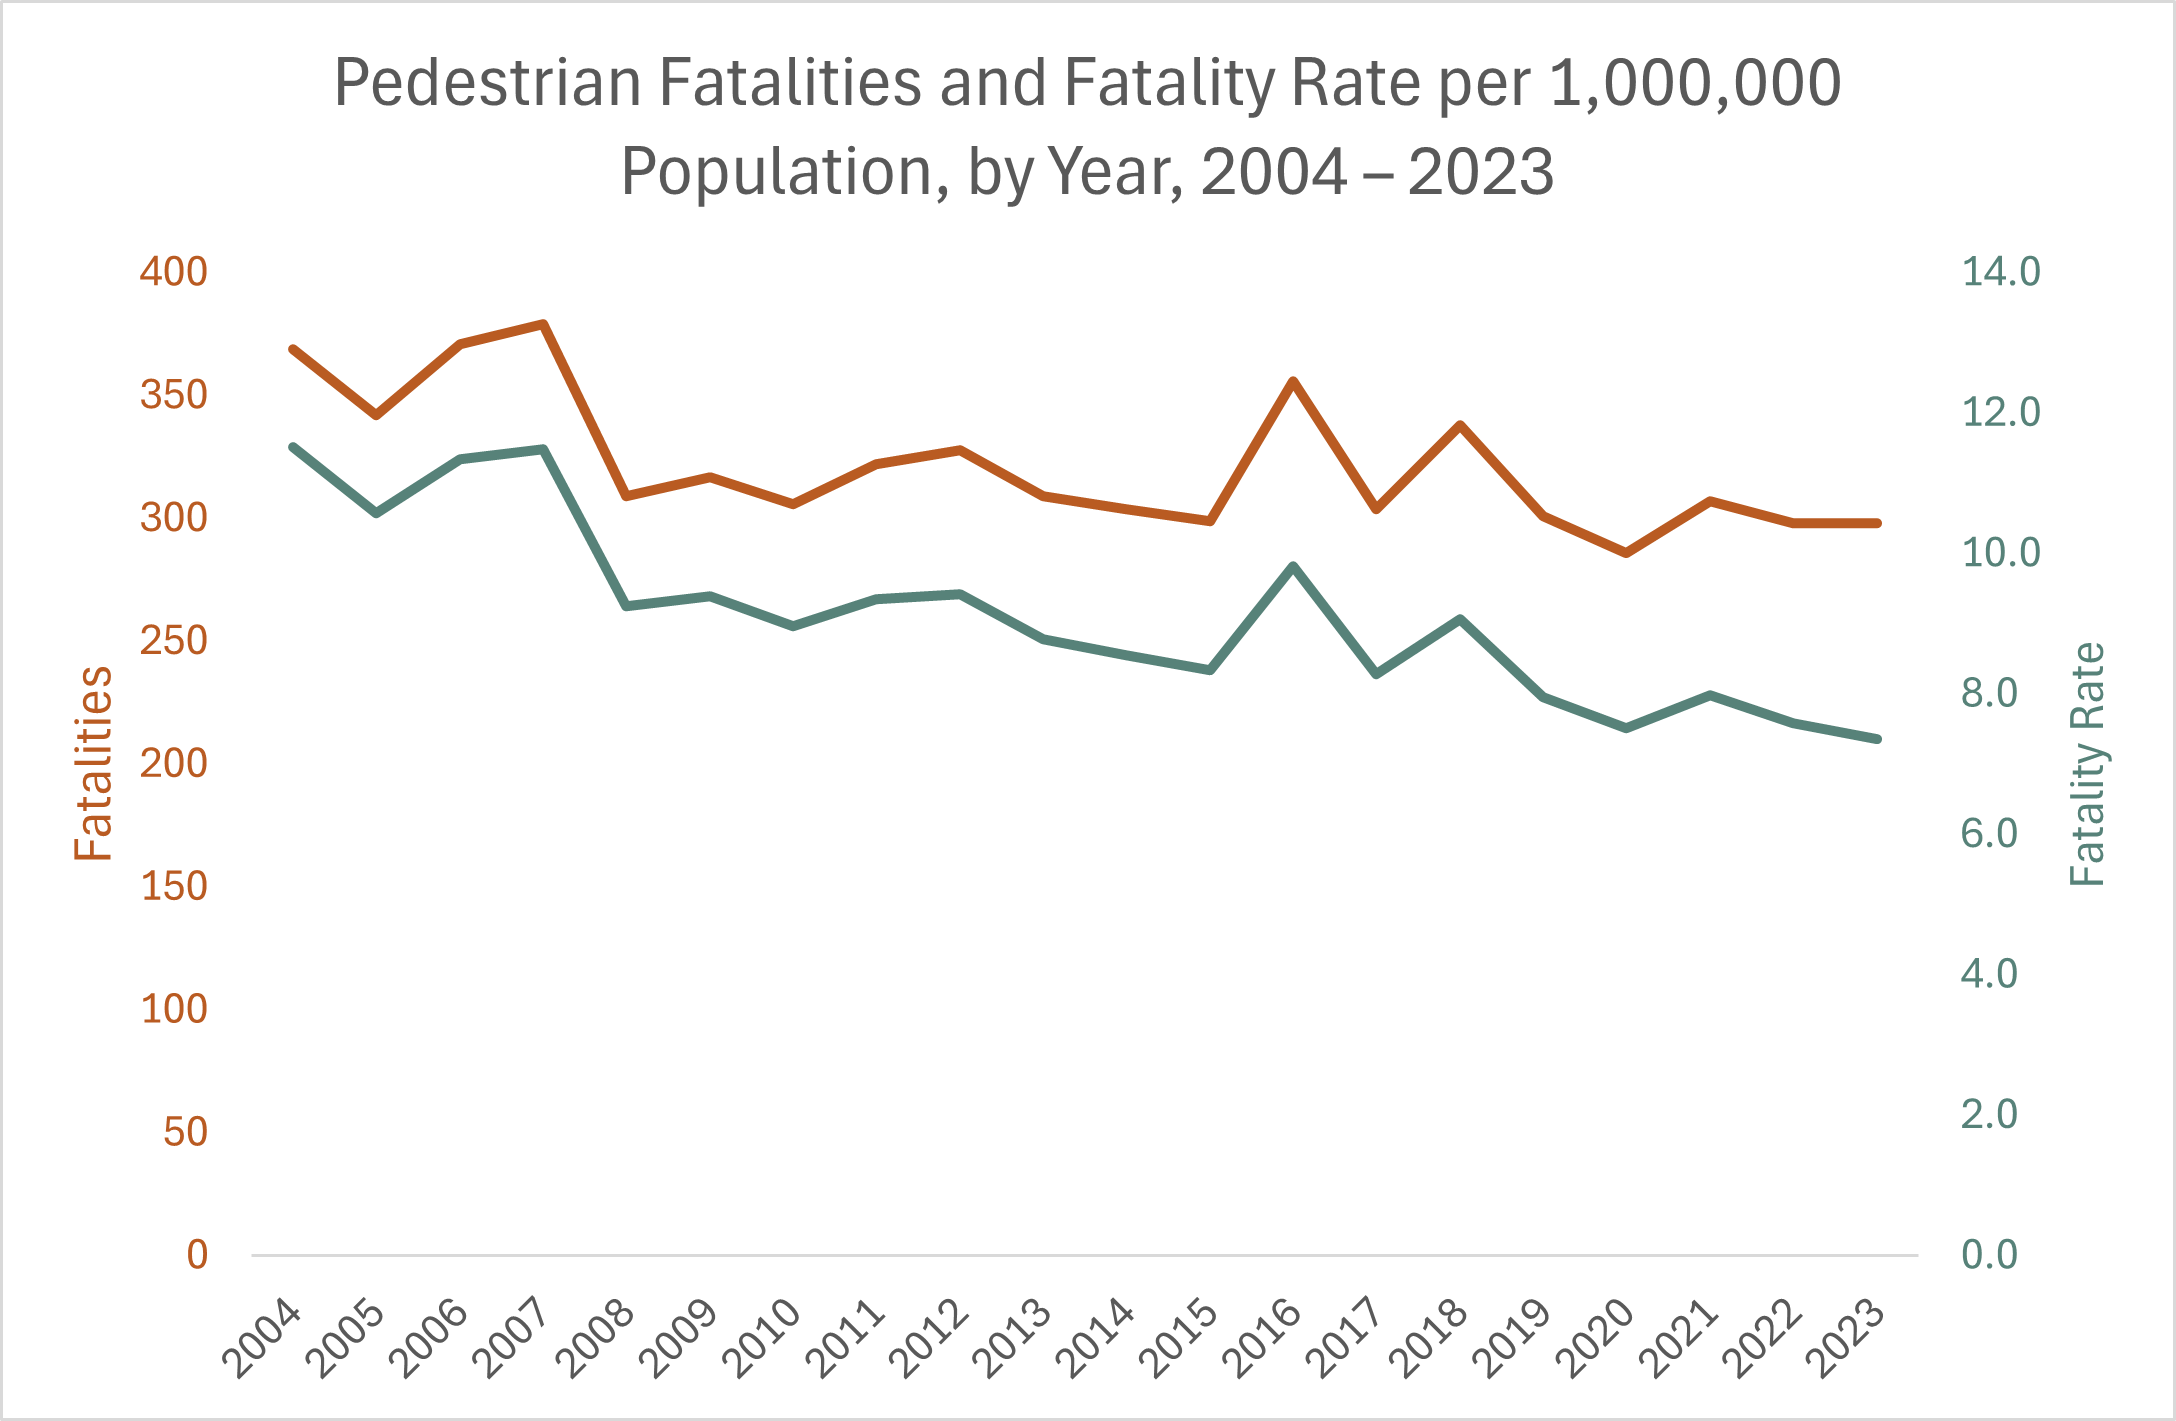
- The number of pedestrians killed per year declined from 369 in 2004 to 298 in 2023. This downtrend was even more pronounced in terms of the rate of pedestrian fatalities per one million population, as Canada’s population increased during this period. See the following chart. (Canada National Collision Database, October 2023; Transport Canada, May 2025)
Fatalities by Age
- Worldwide, road traffic injuries are the leading cause of death among young people aged 5–29. The traffic fatality rate for this age group in low- and middle-income countries is about triple the rate in high-income countries. However, people aged 18–59 account for about two-thirds of road traffic fatalities worldwide. (WHO, December 2023)
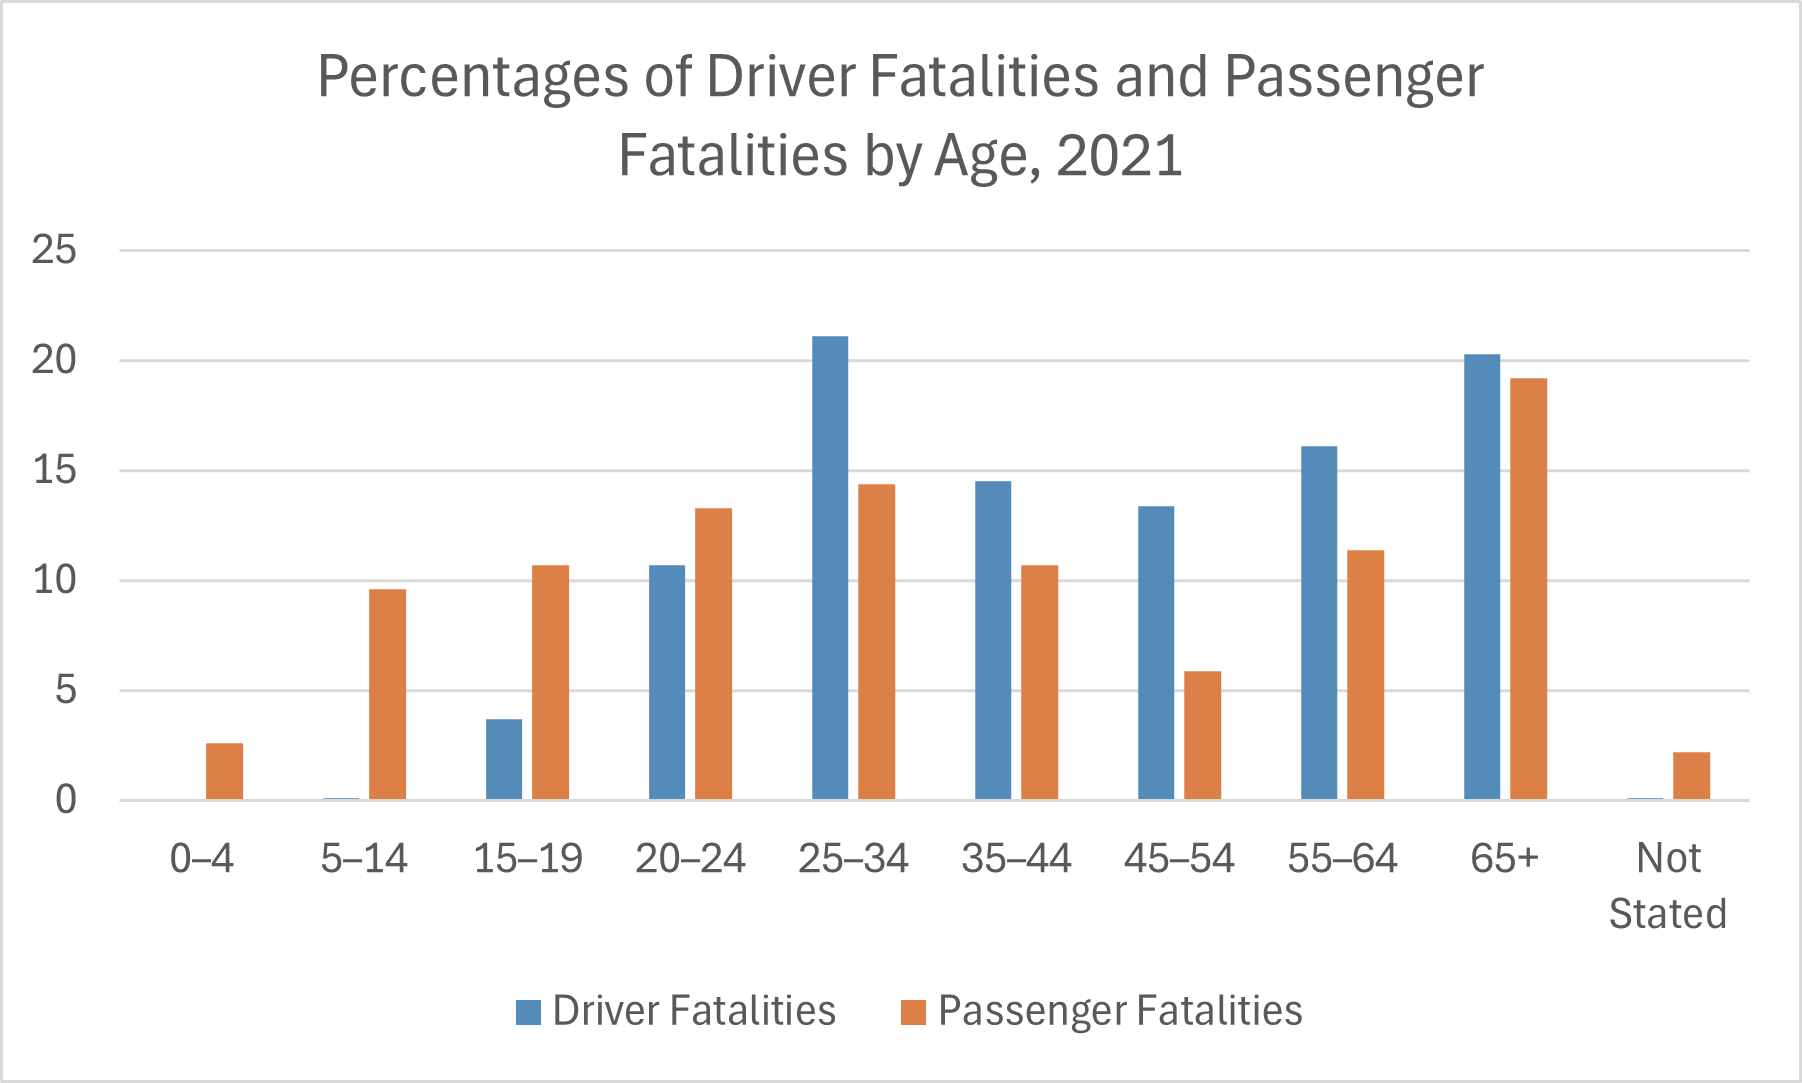
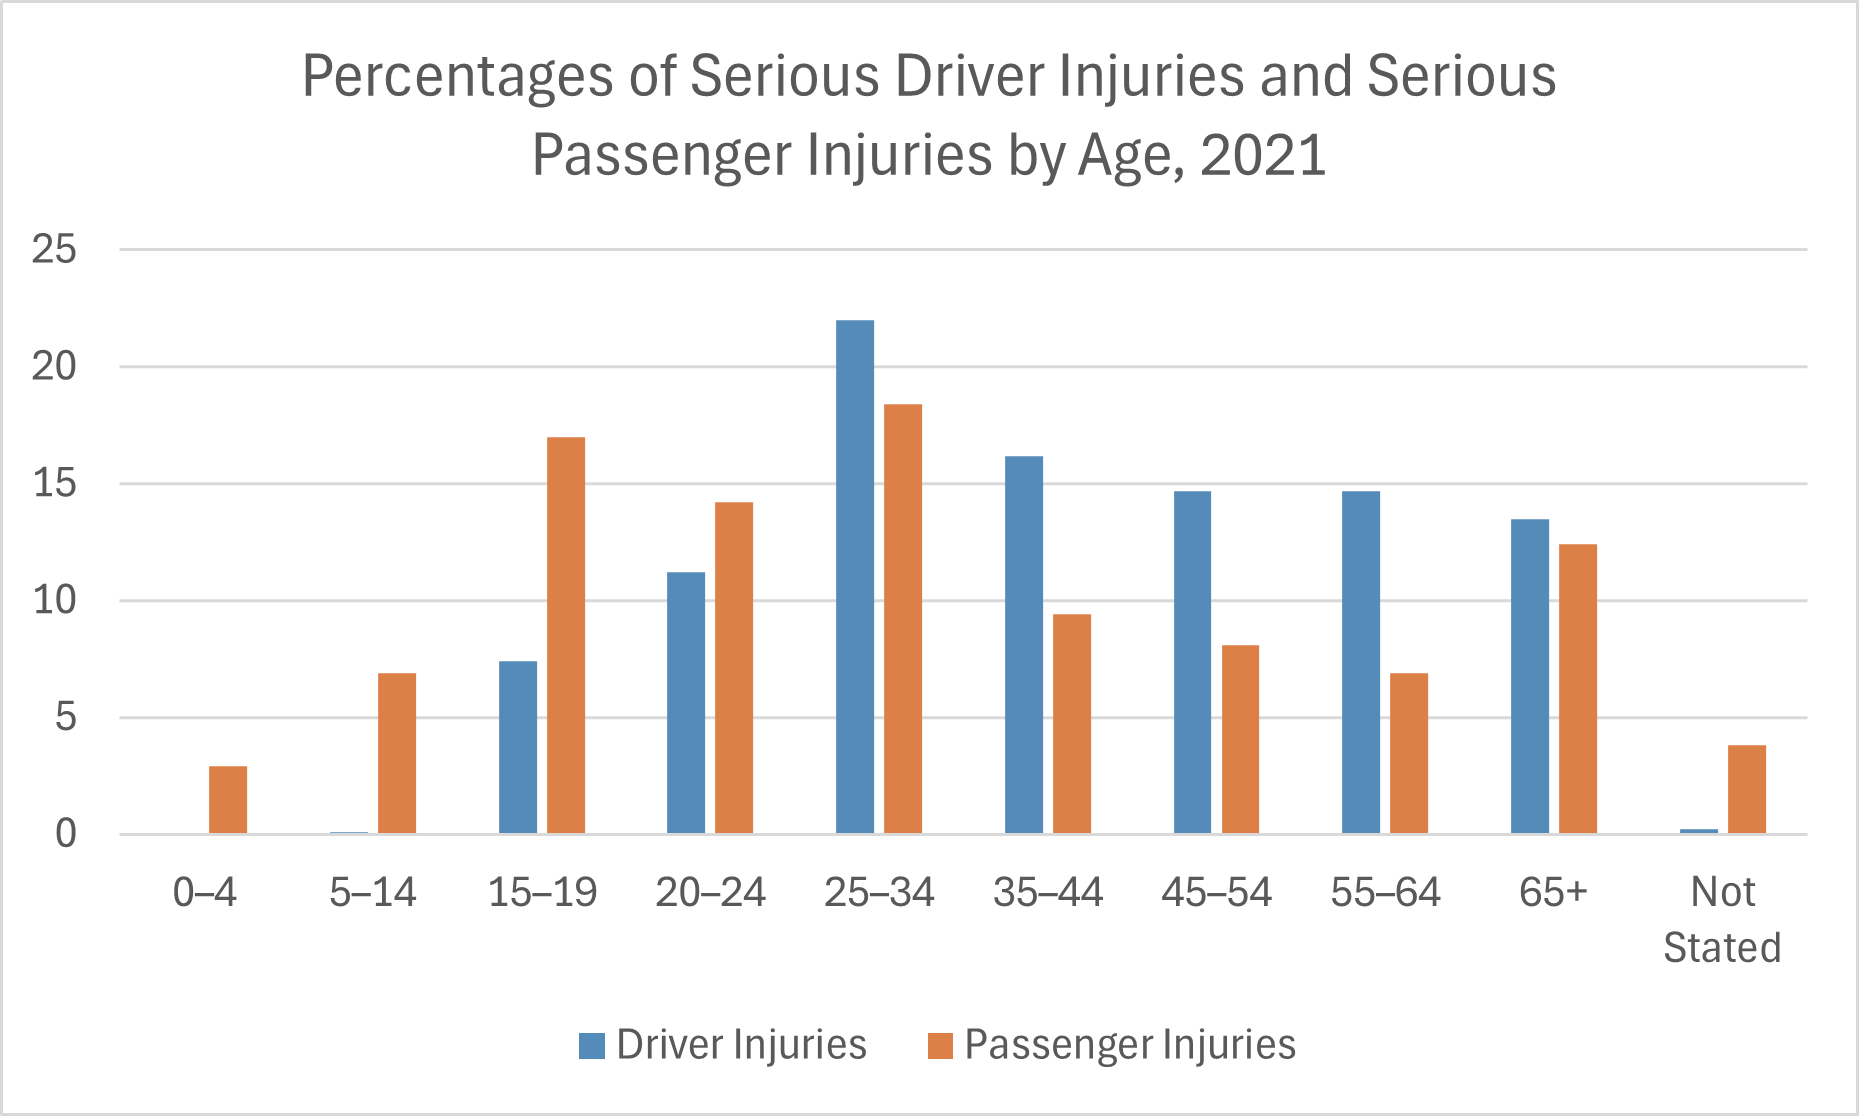
- In Canada in 2021, more drivers aged 25 to 34 died in traffic crashes than drivers in any other age group. However, more passengers aged 65 and older died in crashes than passengers in any other age group. More drivers aged 25 to 34 and more passengers aged 25 to 34 were seriously injured (i.e., requiring hospitalization) than those in any other age groups. The following two charts show the distributions of fatalities and serious injuries by age group. (Transport Canada, 2022)
- Road crashes are the leading cause of death for young people aged 1–24. (Traffic Injury Research Foundation, accessed June 2025)
- Young drivers (drivers under the age of 25) are two to three times more likely to be involved in a crash than older drivers. During their first six months of licensure, young drivers are eight times more likely to be involved in a fatal crash than more experienced drivers. (Traffic Injury Research Foundation, accessed June 2025)
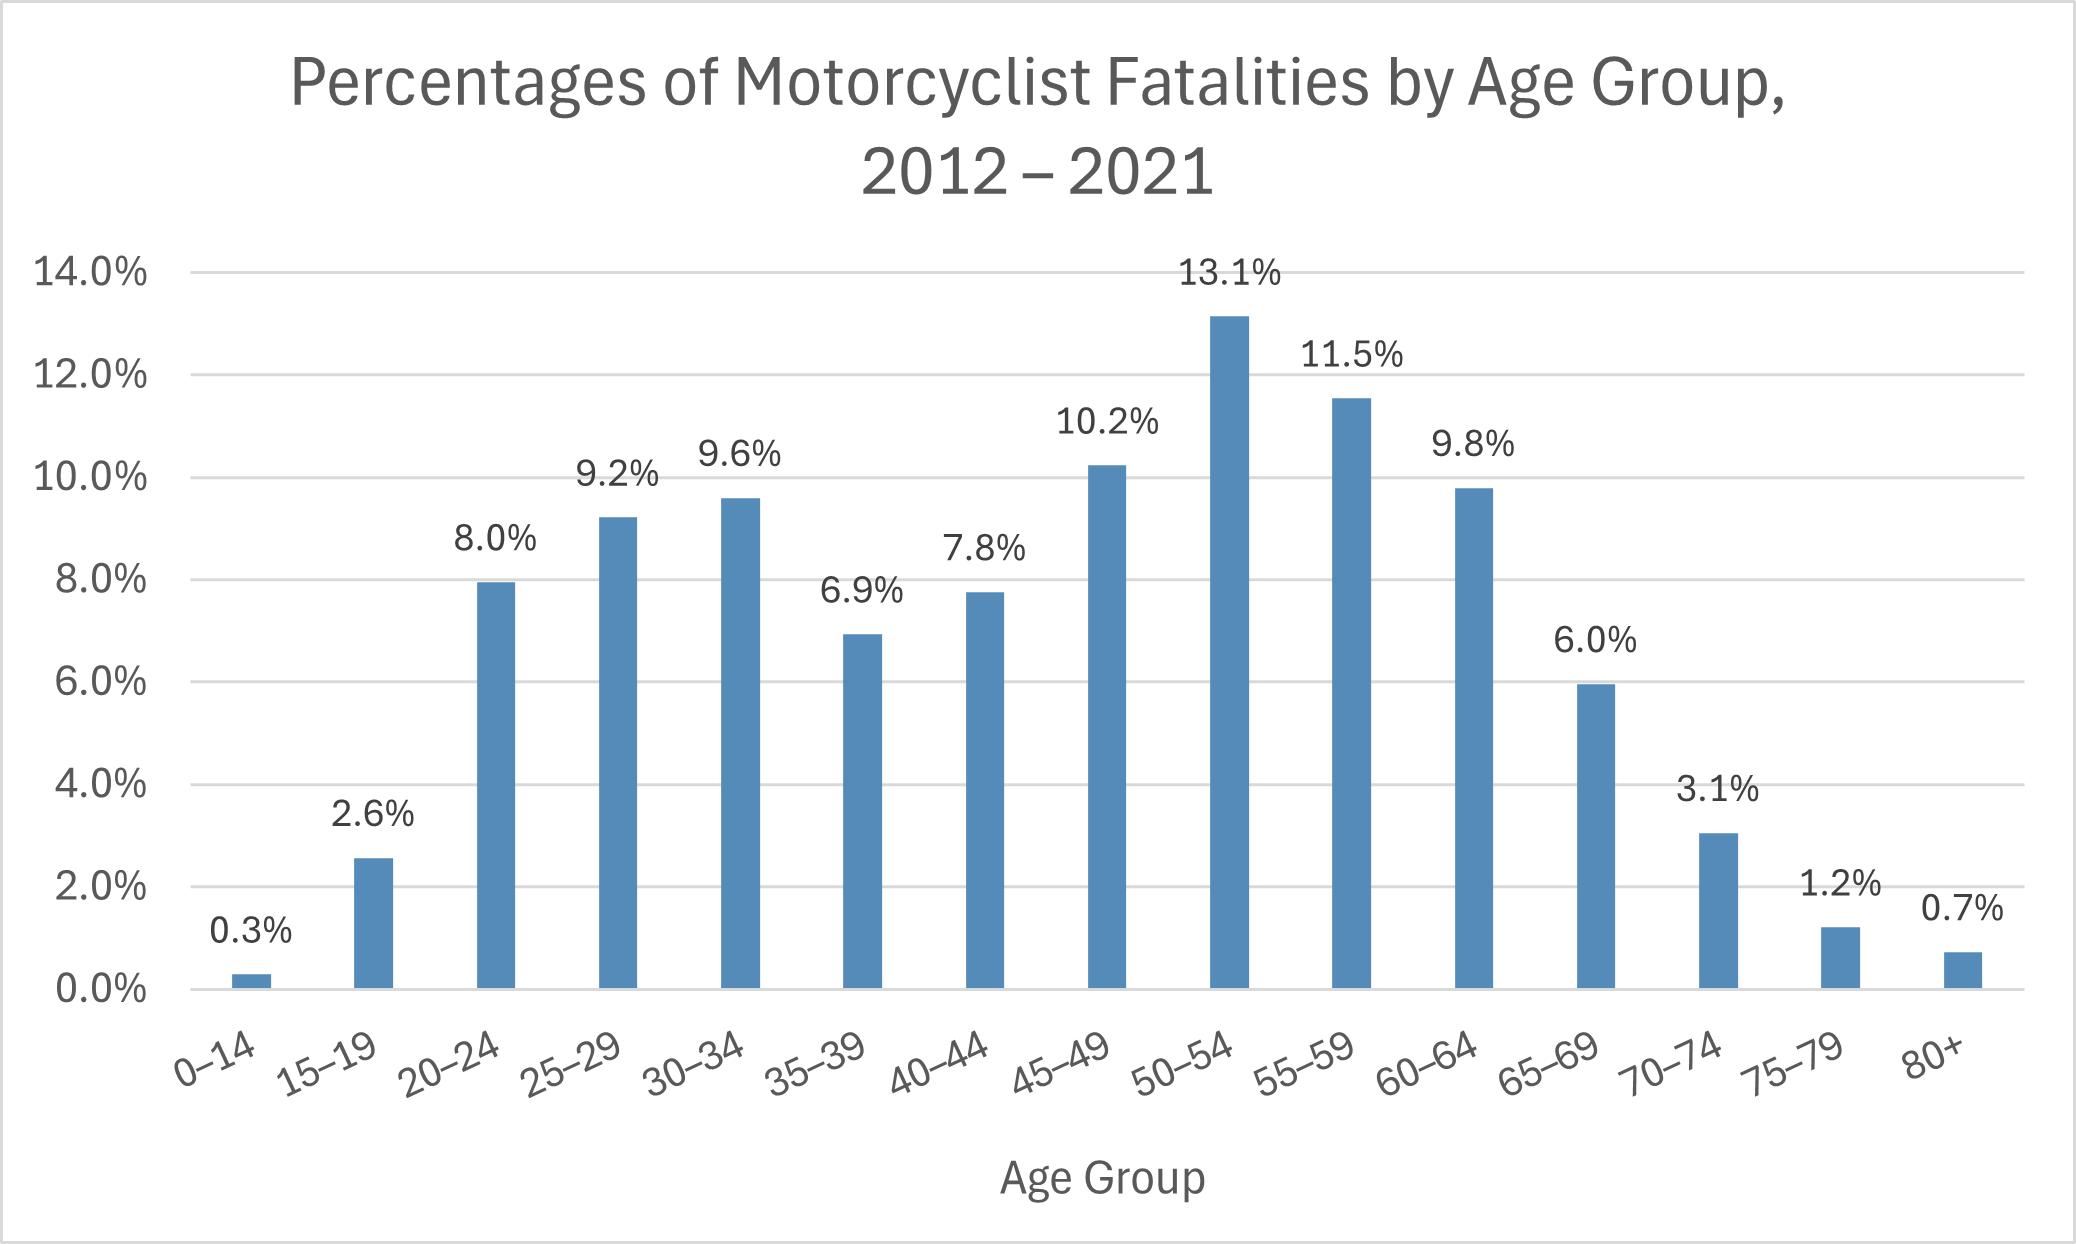
- During the period 2012–2021, there was a total of 2,062 motorcyclist fatalities. (In this context, “motorcyclists” include both motorcycle operators and motorcycle passengers.) The following chart shows the distribution of motorcycle fatalities in this period by age group. Of the 2,062 total fatalities, 13.1% were aged 50–54, more than those in any other age group. (Canada National Collision Database, accessed June 2025)
- The fatal collision rate for drivers of large trucks aged 17–18 was 4.5 times higher than the rate for large truck drivers who were 21 years of age or older. For drivers aged 19–20, it was 6 times higher. (Traffic Injury Research Foundation, 2016)
Fatalities by Gender
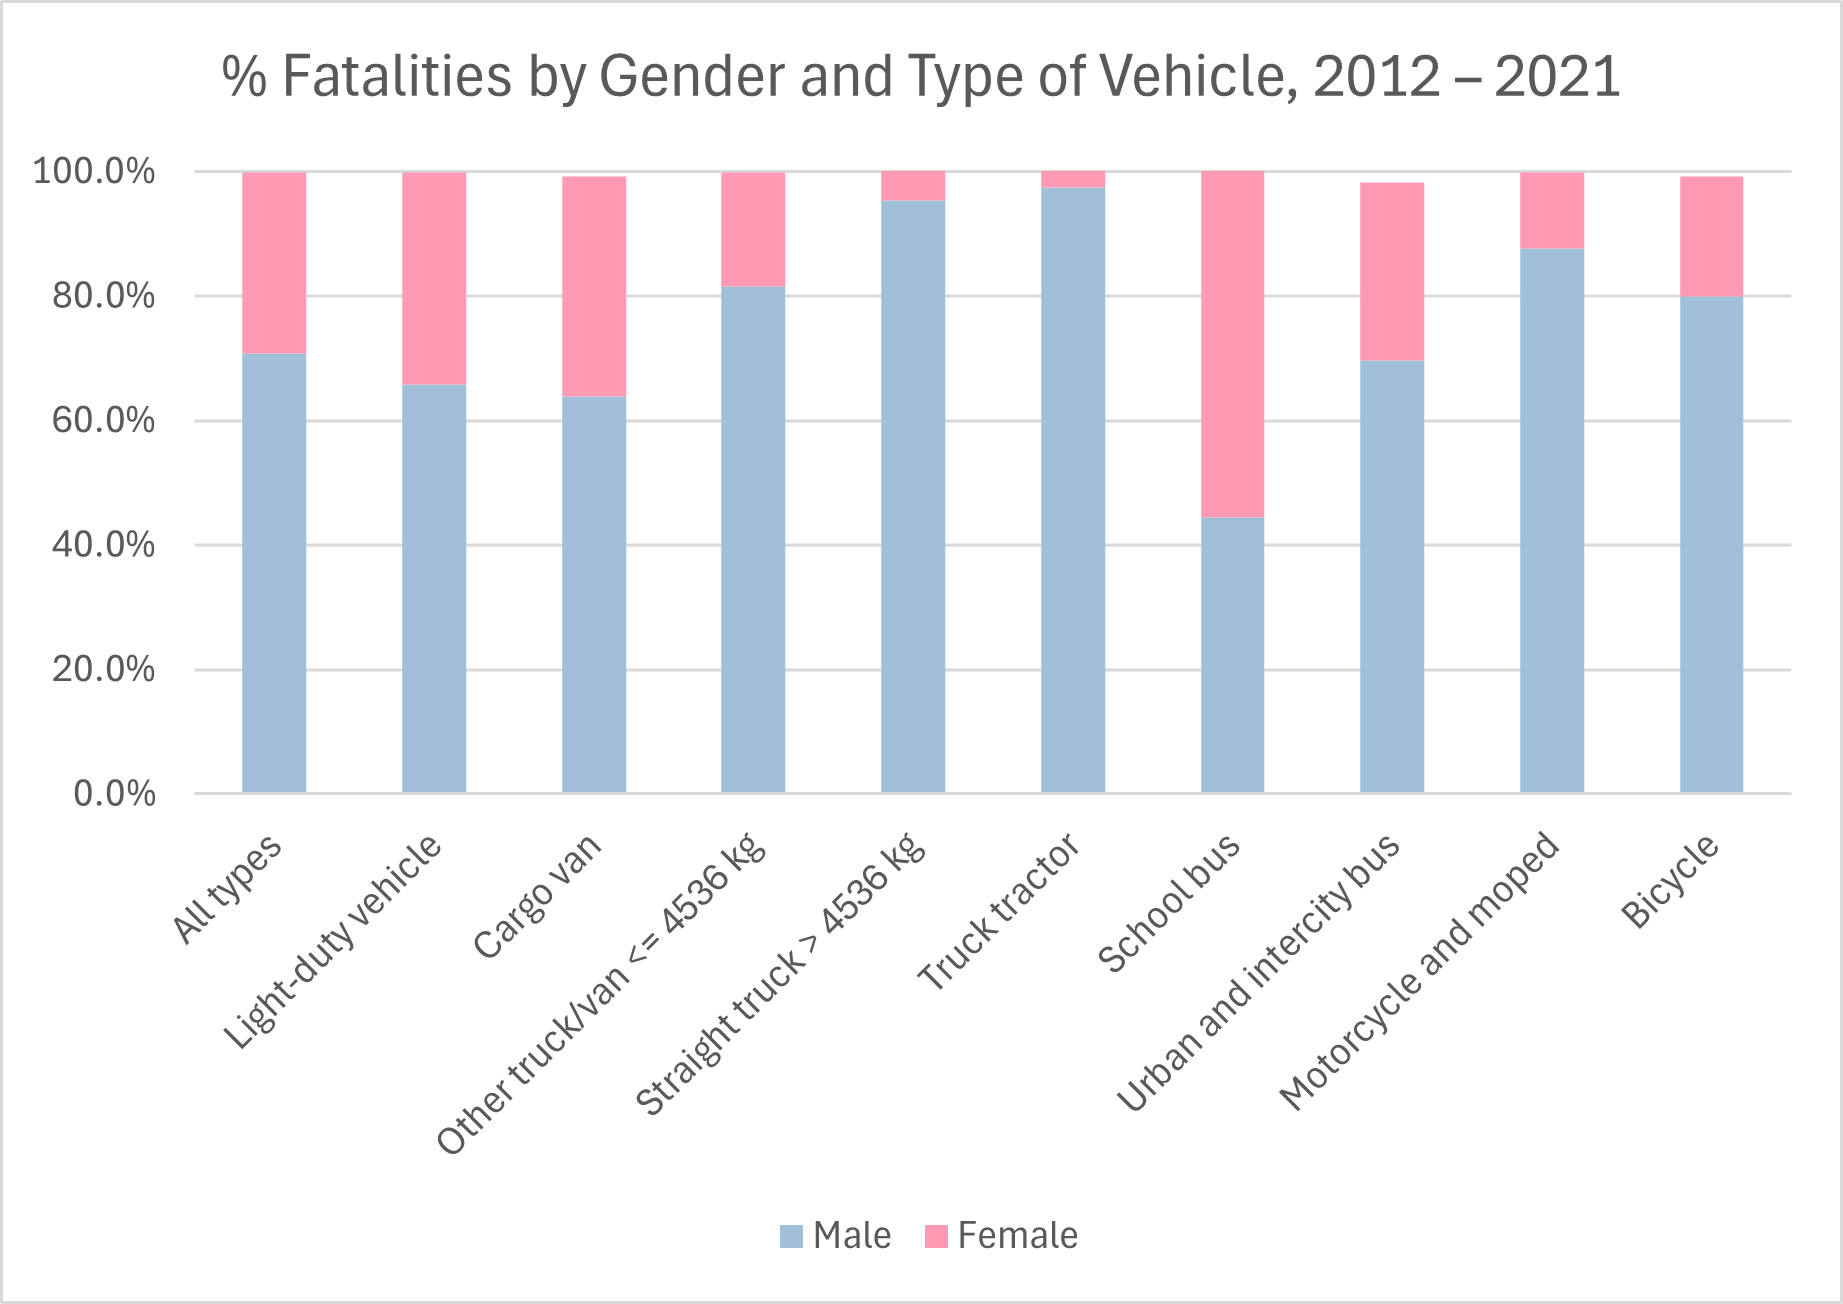
- In the period 2012 to 2021, 70.8% of traffic fatalities were male, and 28.9% were female. The genders of the rest were either unknown or not applicable. The following chart breaks down the percentages of fatalities by gender for various types of vehicles. Males made up 44.4% of fatalities for school buses and 63.9% of fatalities for cargo vans but 97.5% of fatalities for truck tractors and 95.4% of fatalities for large straight trucks. Note that the percentages for male and female do not always sum to 100% because some fatalities for that type of vehicle might be of other genders or unknown gender. (Canada National Collision Database, October 2023)
Effects of the COVID-19 Pandemic
- Previous sections of this document have noted changes in vehicle registrations and driving fatalities occurring in 2020 – 2021, sometimes exacerbating or reversing prior longer-term trends. There is evidence that these changes were caused by the effects of the COVID-19 pandemic and the measures taken to cope with it.
- First, at least some of these changes were statistically significant. In the United States, the AAA Foundation for Traffic Safety had developed predictive models for forecasting monthly traffic fatalities in 2020, based on data obtained from monthly traffic fatalities in 2011–2019. However, the actual traffic fatalities in 2020 significantly differed from the forecasts, falling outside the 95% confidence interval (CI) for forecasted fatalities. In particular, the actual traffic fatalities of persons aged 19–24 exceeded the forecast by 19.0%, and the actual traffic fatalities of persons aged 25–39 exceeded the forecast by 22.8%. Actual traffic fatalities for persons aged 70 and older were 11.9% lower than originally forecast. See the following charts from that same source. (AAA Foundation for Traffic Safety, December 2022)
- Second, although Canadian drivers were driving less from April 2020 to March 2021, there were definite observed increases in various risky driving behaviours by drivers still on the road, compared with 2019. Here are some examples. (Woods-Fry et al., December 2021)
- Edmonton, Alberta: a 200% increase in drivers engaging in “stunt driving” (defined in this context as speeding at more than 50 km/h over the posted speed limit)
- Saanich, British Columbia: a 700% increase in cars impounded for excessive speeding
- Toronto, Ontario: A nearly 200% increase in stunt driving and a 335% increase in speeding tickets
- Ontario, province-wide: a 40.1% increase in stunt driving
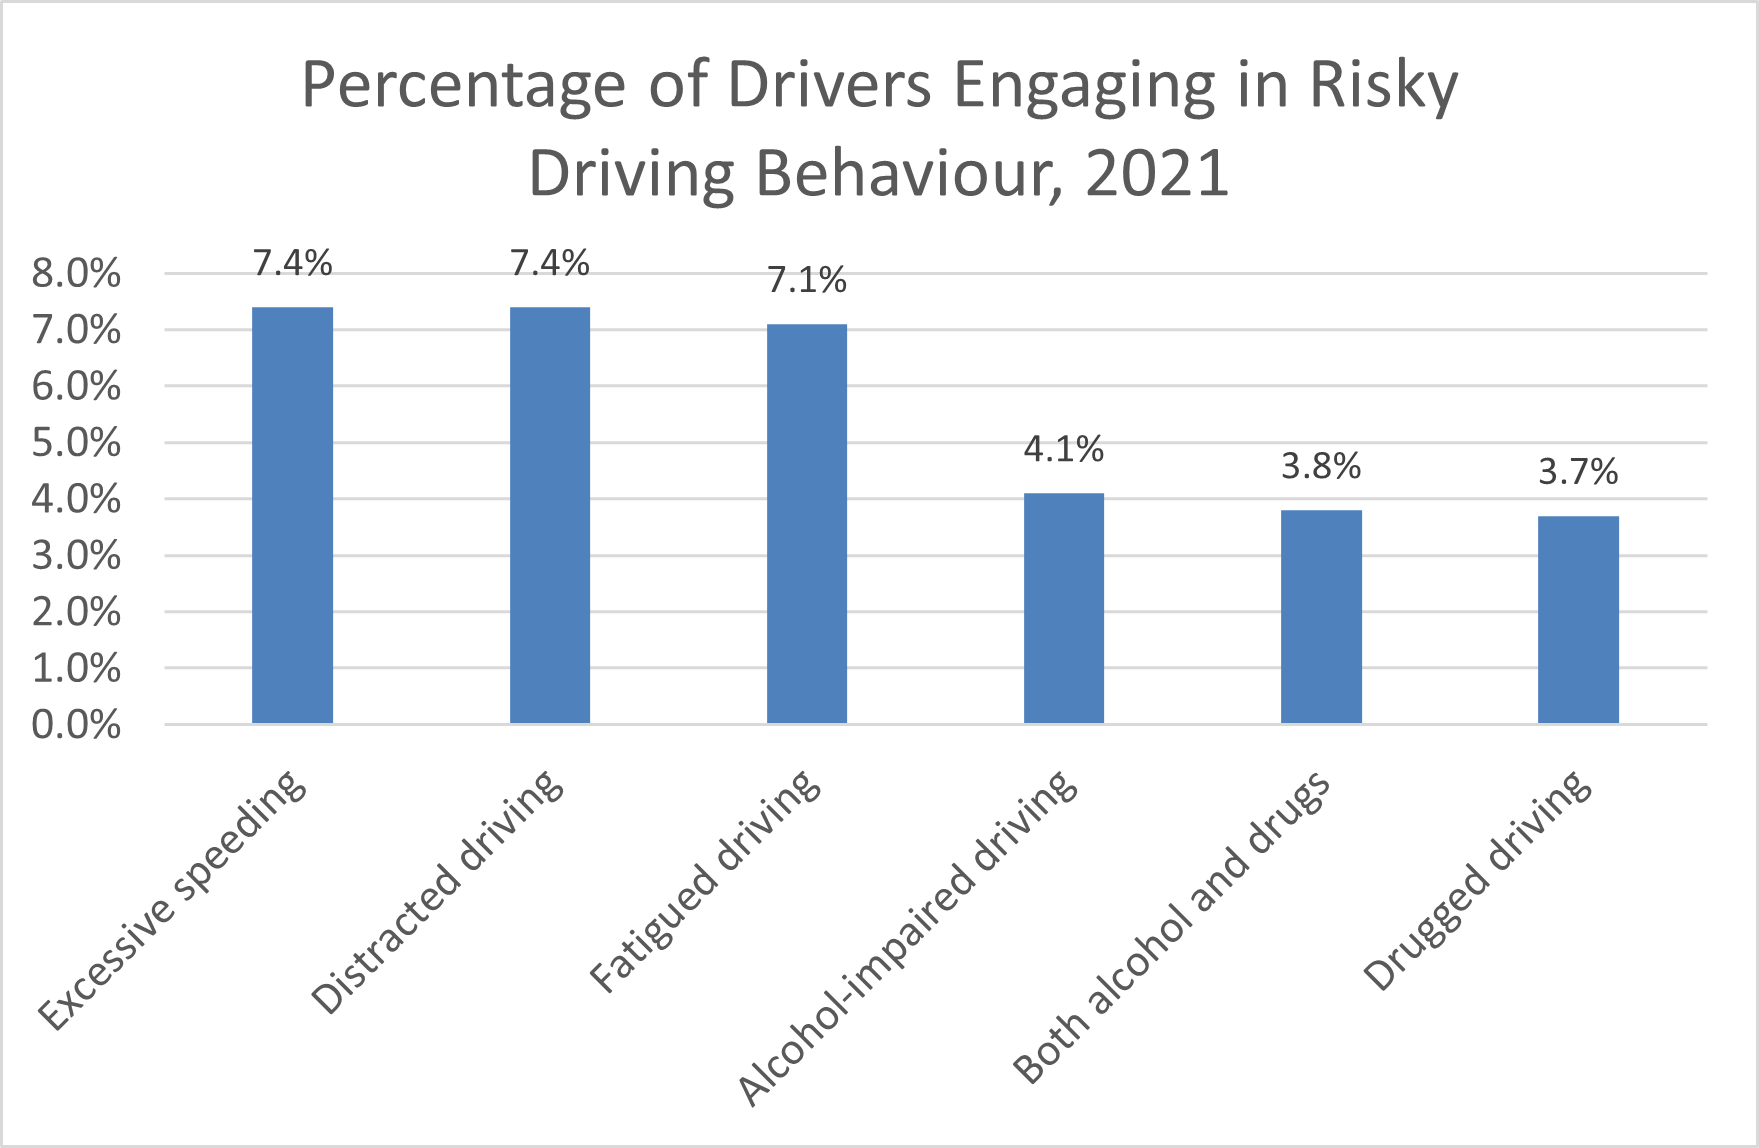
- A survey of 2,700 Canadians in May 2021 found that they were aware of how their driving behaviours (or those of other drivers) had changed because of the pandemic, and they even offered reasons for it. Most drivers claimed that they were no more likely to engage in risky driving than before the pandemic, but a minority admitted to being more likely to drive in a risky manner. For example, 7.4% of drivers admitted to being more likely to engage in excessive speeding. See the following chart. (Woods-Fry et al., December 2021)
- Still, these figures represent only small percentages of drivers who changed their behaviours. There is evidence that the mix or demographics of drivers also changed. Fewer Canadians were commuting to work. The percentage of Canadian workers engaged in remote work (working from home) rose sharply from 7.4% to 24.3%.
As a result, the numbers of workers who commuted to work declined for most major modes of commuting – but not equally for all. Three of the safest modes (in terms of commuting fatality rates) – train, subway, and bus – declined the most, while two of the riskier modes (motorcycle and car) fell the least. See the following chart. (Statistics Canada, November 2022)
Distracted Driving Statistics
- Worldwide, drivers using mobile phones are about four times as likely to be involved in a crash as drivers not using mobile phones. (WHO, December 2023)
- In 2011–2012, researchers in three Mexican cities observed cell phone use as high as 10.8% among motorcycle operators while they were driving. (Vera-López, Juan et al., November 2012)
- In 2021, distracted driving was a contributing factor in an estimated 22.5% of fatal collisions and an estimated 25.5% of serious injury (i.e., requiring hospitalization) collisions. (Transport Canada, April 2024)
- In Desjardins Insurance’s 2025 road safety survey, 60% of the 4,000 Canadians polled cited distracted driving as the biggest road hazard they face, more than the 59% who named impaired driving and the 46% who named aggressive driving. This was the third straight year in which most respondents cited distracted driving as the biggest road hazard. The most common distractions named by respondents were external distractions (34%), cellphone use (31%), in-car media systems (24%), and eating or drinking (22%). (Desjardins Insurance, February 2025)
- CAA polls of Canadian drivers in 2020 and 2021 found that 79% of them admitted to engaging in distracting behaviours. Besides texting, 47% of these drivers admitted to programming a destination on their navigation app or device while driving. 78% of them admitted that they frequently change the radio station while driving. (CAA, 2020 and 2021)
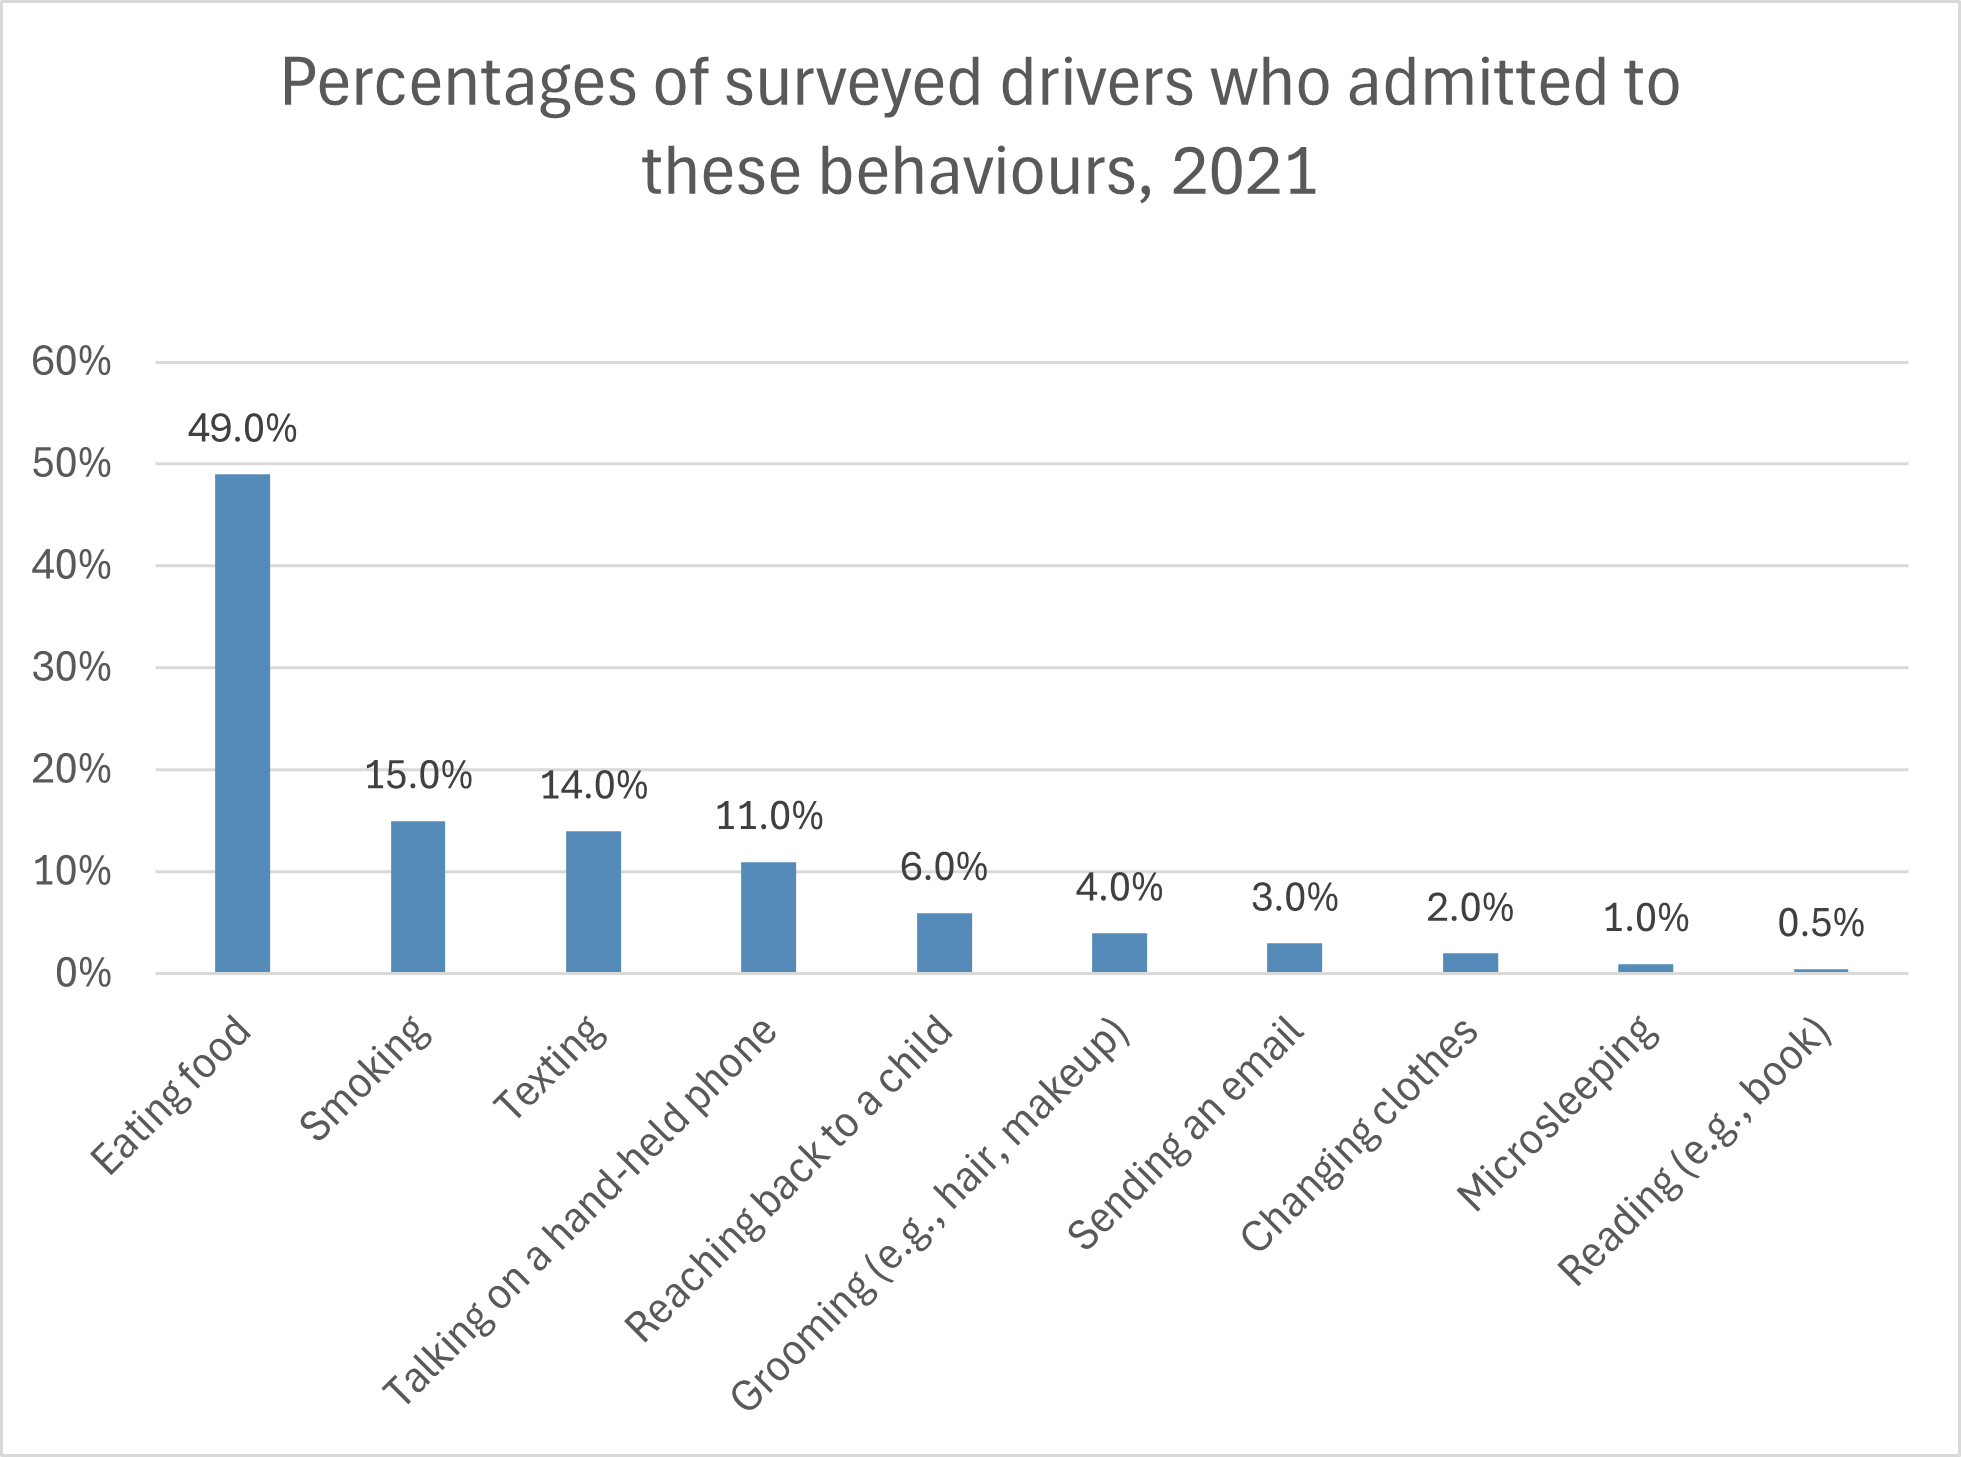
- A survey of 1,027 Canadian drivers in 2021 found that more than half of them admitted to engaging in various distracted driving behaviours while driving. The most common was eating food (49% of surveyed drivers). 15% of drivers admitted to smoking while driving. 14% of drivers read or sent text messages. 11% talked on a hand-held cell phone. See the following chart. (Finder.com, September 2021)
30% of drivers surveyed in 2023 admitted to having been involved in a crash caused by their distractions, and 19% of drivers reported that they had been involved in a crash caused by another driver’s distracted driving. Many of these respondents admitted to having driven distracted themselves. See the following table. (Travelers Canada, April 2023)
|
Distraction |
% of Drivers Engaging in |
|
Use a cell phone or hands-free device |
63% |
|
Eat or drink |
58% |
|
Look at a map on a cell phone or electronic device |
56% |
|
Make or receive phone calls |
48% |
|
Read texts or e-mails |
21% |
- A web survey of Canadian drivers in 2017 found that 14% of them admitted to having engaged in romantic activities while driving, and 3% of them admitted to having flossed while driving. (belairdirect, 2017)
- Dialling a phone is one of the most dangerous distractions, increasing a driver's chance of crashing by 12 times. Reading or writing increased the risk of crashing by 10 times. Driving while crying or visibly angry also increased the risk of crashing by 10 times. (Virginia Tech Transportation Institute, 2016)
- Child passengers can be 12 times more distracting to a driver than talking on a cell phone. One study found that the average parent driver took his or her eyes off the road for three minutes and 22 seconds during a 16-minute trip. (Monash University, 2013)
- Manual transmission vehicles double the chances of distracted driving crashes caused by food consumption. (Drive-Safely.net, 2019)
- Based on naturalistic driving data in the United States, drivers of vehicles equipped with Level 2 driving automation systems were nearly twice as likely to drive distracted when the systems were active and the drivers had prior experience with such systems. This did not happen with drivers who had no prior experience with such systems. (Virginia Tech Transportation Institute, accessed April 2025)
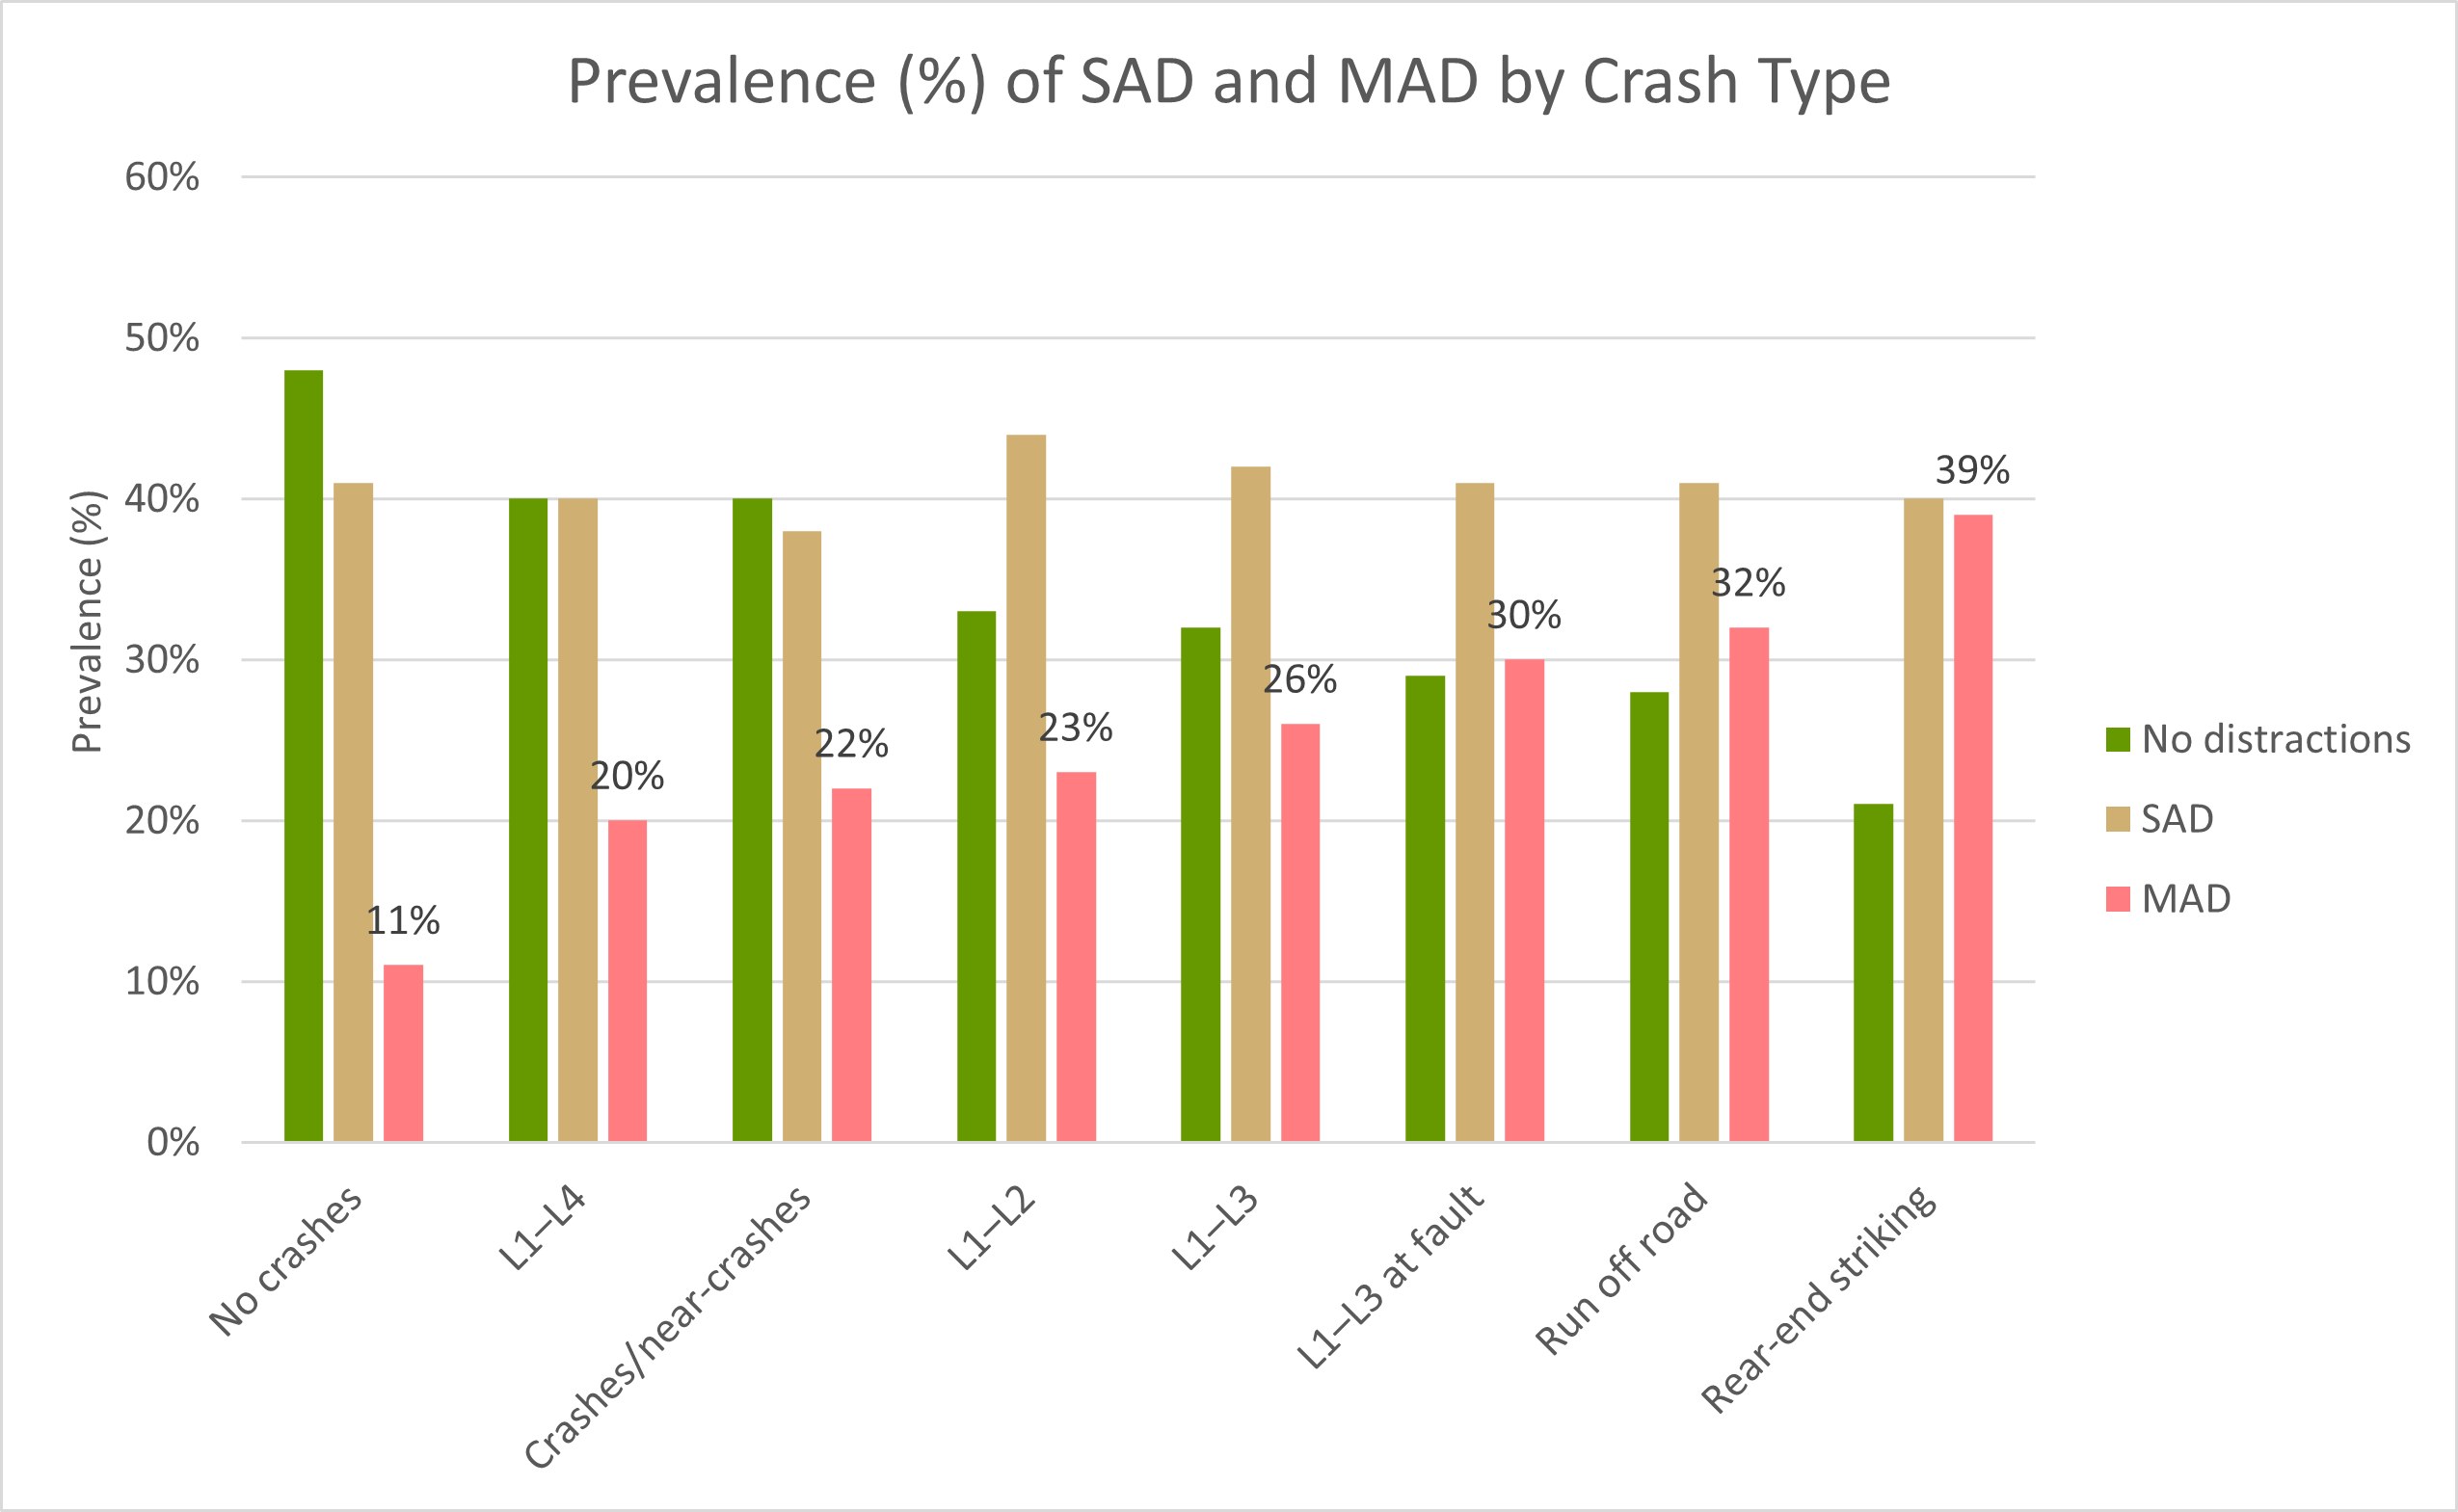
- A US study based on naturalistic driving data looked at the prevalence of “multitasking additional-to-driving (MAD)” (situations where two or more distractions took place at the same time), compared with “single task additional-to-driving (SAD)” (situations with just one distraction). The prevalence of SAD or MAD was defined as the percentage of times that particular distracting situation occurred. Crashes were coded as four levels: L1, the least serious (tire strikes) to L4, the most serious. The prevalence of SAD remained within a narrow range (38% to 44%) for all crash scenarios, but the prevalence of MAD varied significantly, from 11% when no crashes occurred to 39% for rear-end striking (i.e., when the driver’s vehicle rear-ended the vehicle ahead), which was just slightly less than the 40% for SAD. This meant that a whopping 79% of rear-end crashes involved distracted driving, and more than one-third of the rear-end crashes involved multiple distractions. See the following chart. (Virginia Tech Transportation Institute et al., January 2020)
- By March 2024, 145 countries worldwide had banned the use of hand-held cell phones while driving. (Johns Hopkins International, March 2024)
- In Canada, all 10 provinces plus the Yukon, Northwest, and Nunavut territories have banned the use of hand-held cell phones while driving except in emergencies, although the penalties vary among these provinces and territories. (CAA, 2020)
- In 2002, Newfoundland and Labrador was the first province to enact a ban on the use of hand-held cell phones while driving. Nunavut, in 2019, was the last. Some provinces have gone further. Alberta also specifically bans some other potentially distracting activities while driving, such as personal grooming and reading or writing hardcopy materials. In British Columbia, it is illegal to wear earbuds in both ears while driving. In Ontario and Quebec, it is illegal to watch a display screen for a purpose unrelated to driving, such as to watch a video. Elsewhere in Canada, you may be charged with dangerous driving or driving without due care if you engage in such activities while driving. (Canada Drives, 2024)
Texting and Driving Accident Statistics
- Texting increases your chances of rear-ending someone by a factor of 7. (AAA Foundation for Traffic Safety, 2018)
- 33% of Canadians admit they have texted while stopped at a red light, despite believing it is unacceptable. (CAA, 2016)
- 47% of Canadians admitted that they have typed a text message or used the voice-memo feature to send a text message while driving. (CAA polling, 2020)
- Texting takes an average of 4.6 seconds. At 90 km/h, a vehicle travels 115 metres in 4.6 seconds. (NHTSA, 2009)
- The maximum amount of time that a driver can safely divert his or her attention from the road is two seconds. (TeenSafe, 2018)
Alcohol-Impaired Driving Statistics
- From September 2016 to September 2018, roadside surveys of drivers in British Columbia, Manitoba, Ontario, Yukon, and Northwest Territories from 11 p.m. to 3 a.m. found that 4.4% of the surveyed drivers tested positive for alcohol, and 0.7% of the drivers had a blood alcohol concentration (BAC) of 0.08% or greater. (0.08% is the threshold for legal intoxication.) 5.1% of the drivers aged 25 to 34 tested positive for alcohol, the highest percentage of all age groups. However, only 2.1% of drivers aged 16 to 19 tested positive for alcohol. 21.9% of drivers who tested positive for alcohol also tested positive for drugs. These figures indicate a major decline in alcohol-impaired driving over the previous 20 years but an increase in drug-impaired driving since cannabis was legalized. (In 1998, 14.9% of surveyed drivers tested positive for alcohol, and 2.4% of drivers had a BAC of 0.08% or greater.) (Canadian Council of Motor Transport Administrators, September 2019)
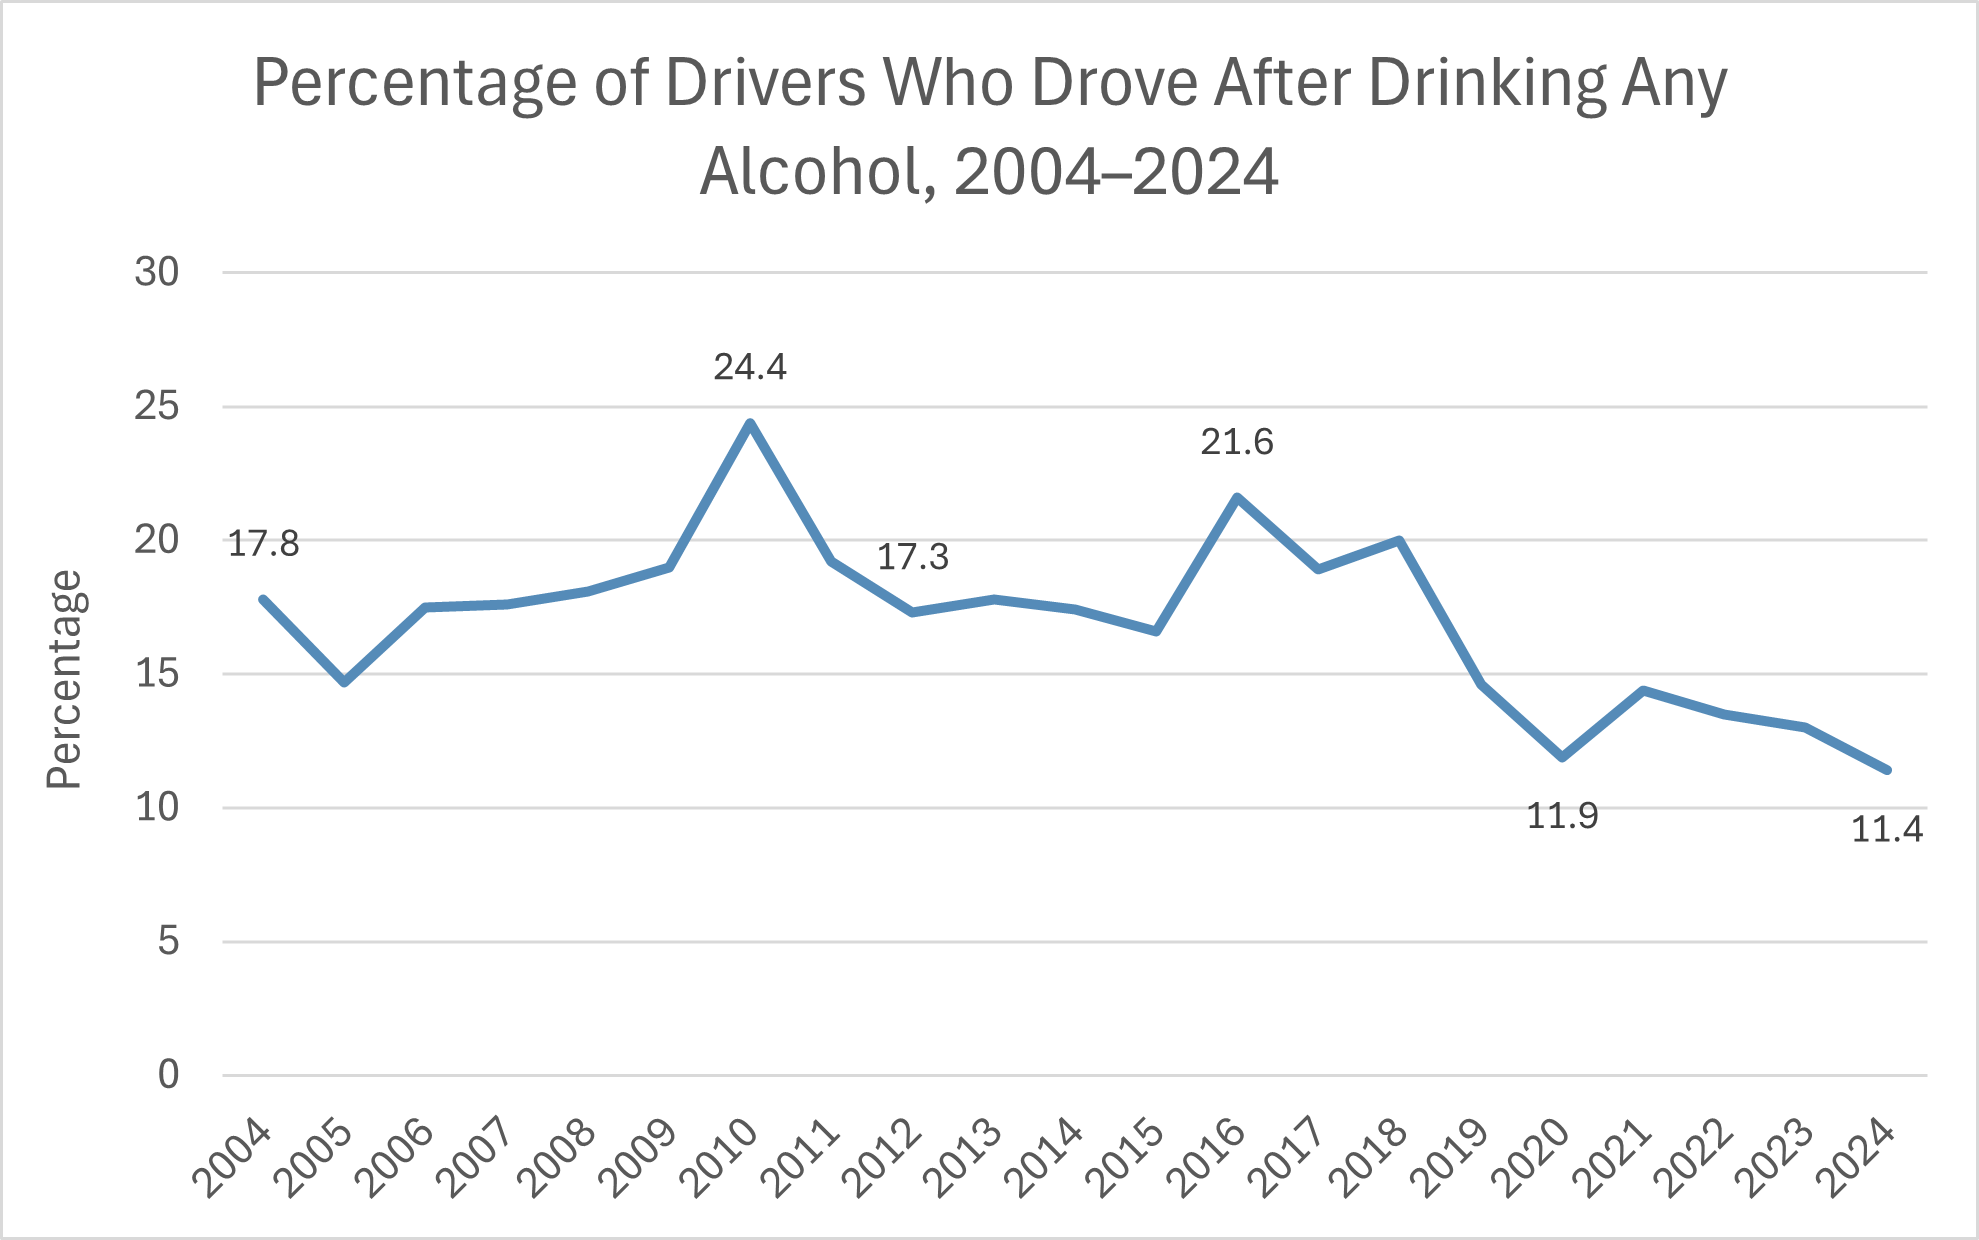
- In 2024, the annual Road Safety Monitor (RSM) national poll of Canadians on road safety issues asked drivers whether they had driven despite consuming alcohol within the previous 30 days. This chart summarizes the results. Starting in 2011, there was a long-term downtrend in the percentage of drivers who admitted to doing this. In 2010, 24.4% of drivers admitted to driving despite consuming alcohol, but in 2024, only 11.4% of drivers admitted to it. (Traffic Injury Research Foundation, December 2024)
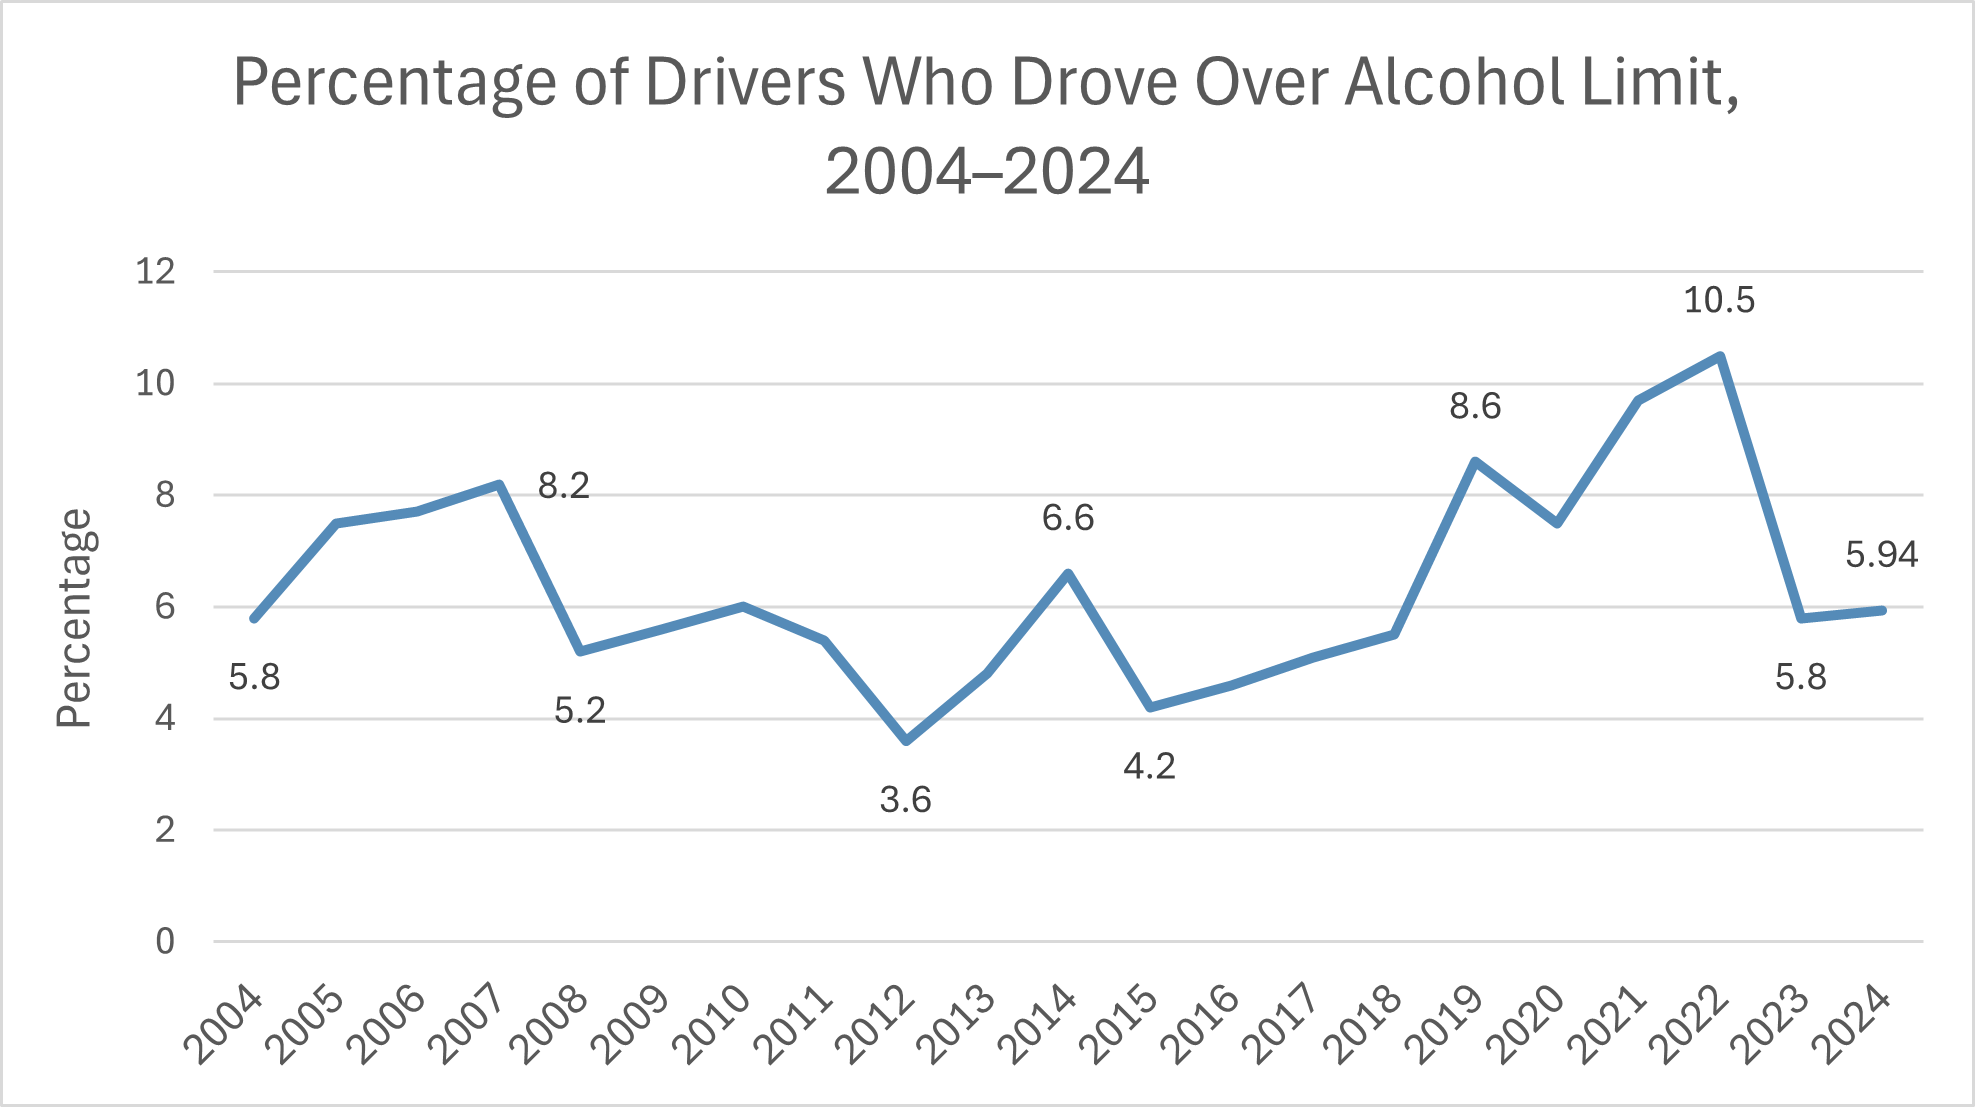
- Next, the poll asked whether respondents had driven despite consuming so much alcohol that they believed they were over the legal limit. Here, the long-term picture was more complex. The percentage of drivers who admitted to doing this declined from 8.2% in 2007 to a low of 3.6% in 2012. Then a longer-term uptrend began, reaching a high of 10.5% in 2022 before this uptrend was finally broken starting in 2023. See the following chart. (Traffic Injury Research Foundation, December 2024)
- In 2019, 155 people died in crashes caused by impaired driving. 88 (57%) of these fatalities were the drivers, and 67 (43%) were other road users. (Statistics Canada, July 2021)
- In 2023, impaired driving was a contributing factor in 21.9% of fatal collisions. (Transport Canada, May 2025)
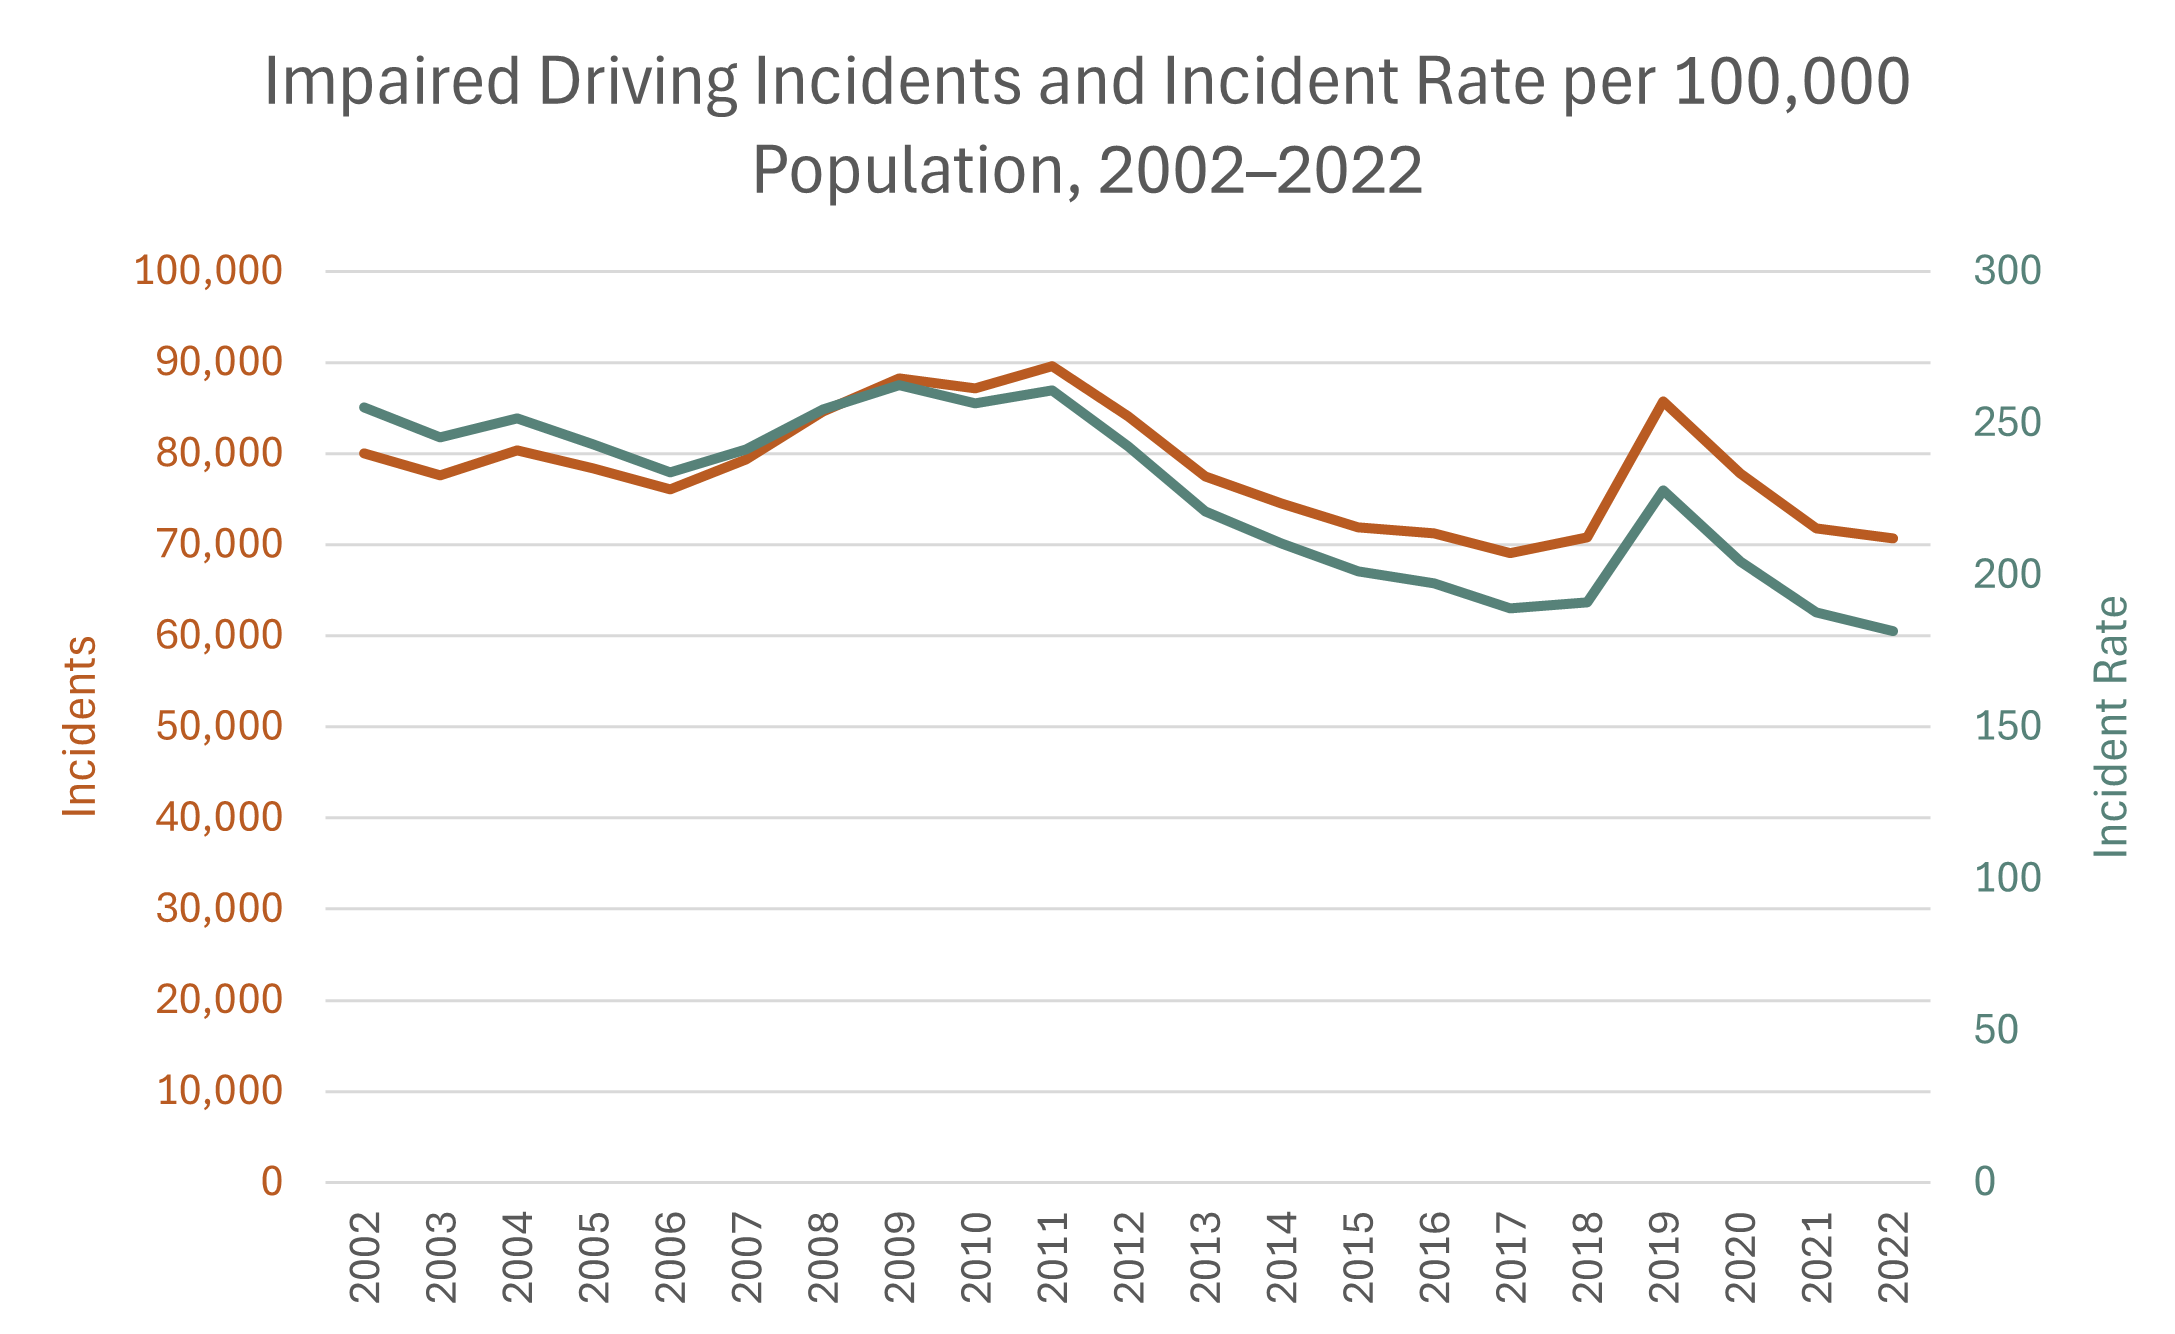
- In 2019, police reported 85,804 incidents of impaired driving, the highest number since 2011. The impaired driving rate (from alcohol, drugs, or both) also increased by 19% from 2018, breaking a downward trend that had begun in 2011. However, these increases proved temporary; the downward trend resumed the following year. See the following chart. Note: During this period, there were several changes made to how incidents were reported to the national Uniform Crime Reporting (UCR) Survey. Bear this in mind when interpreting this data. (Statistics Canada, accessed June 2025)
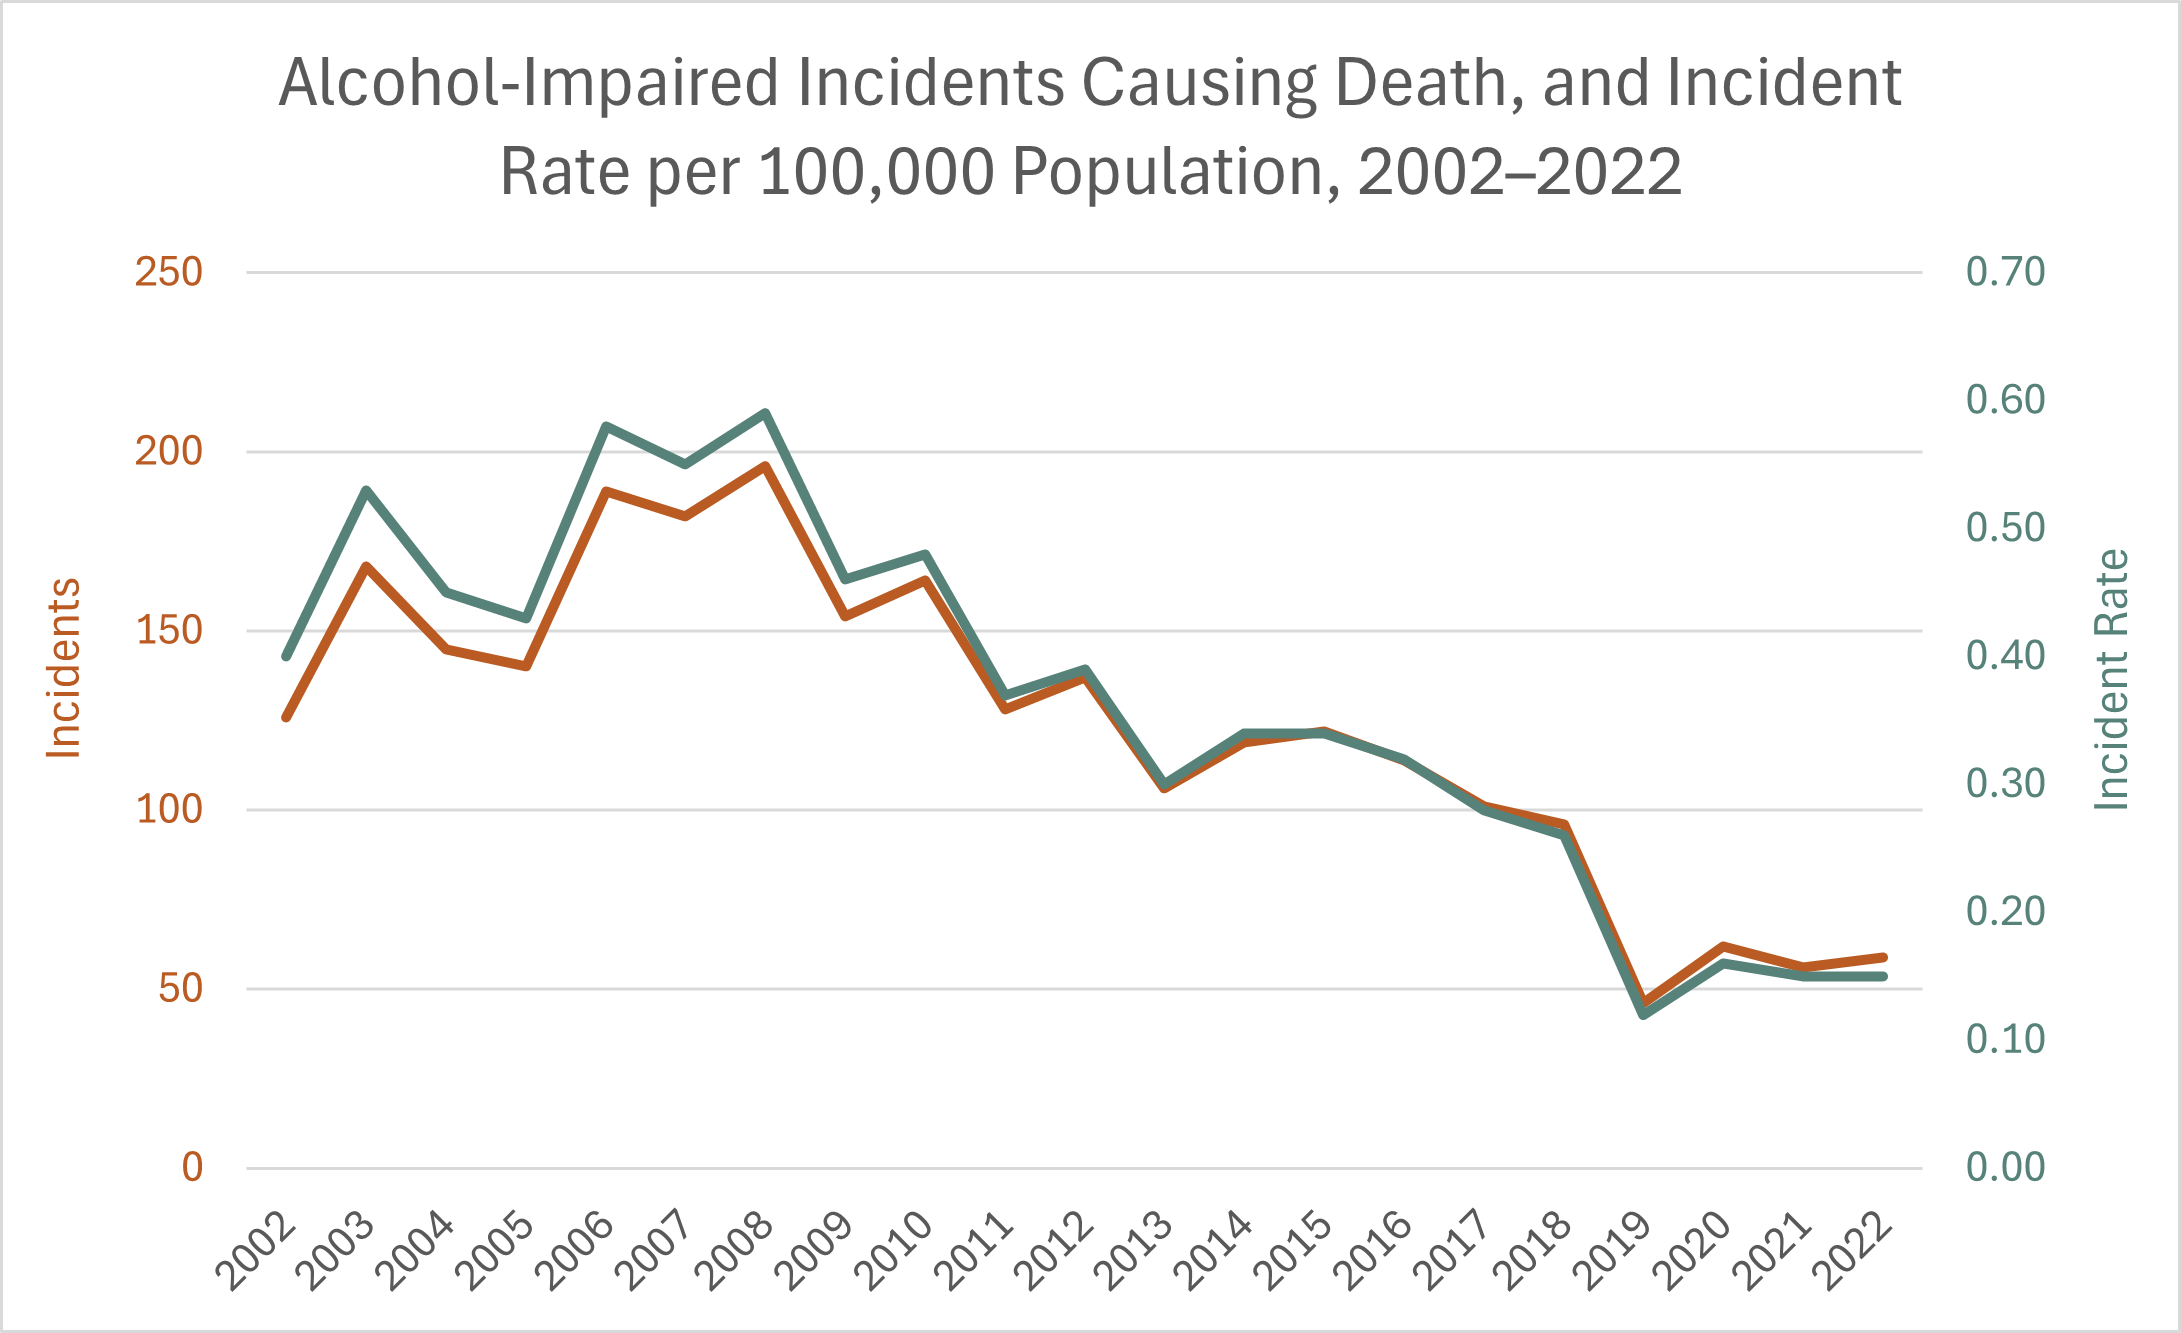
- In 2008, 196 alcohol-impaired driving incidents caused fatalities. Since then, there has been a steep decline in fatal alcohol-impaired incidents, down to just 59 in 2022. The rate of such incidents per 100,000 population declined even more sharply as Canada’s population grew. See the following chart. (Statistics Canada, accessed June 2025)
- In 1986, intoxicated female drivers accounted for 1 in 13 alcohol-related crashes. By 2015, this proportion had risen to 1 in 5. (Traffic Injury Research Foundation, December 2016)
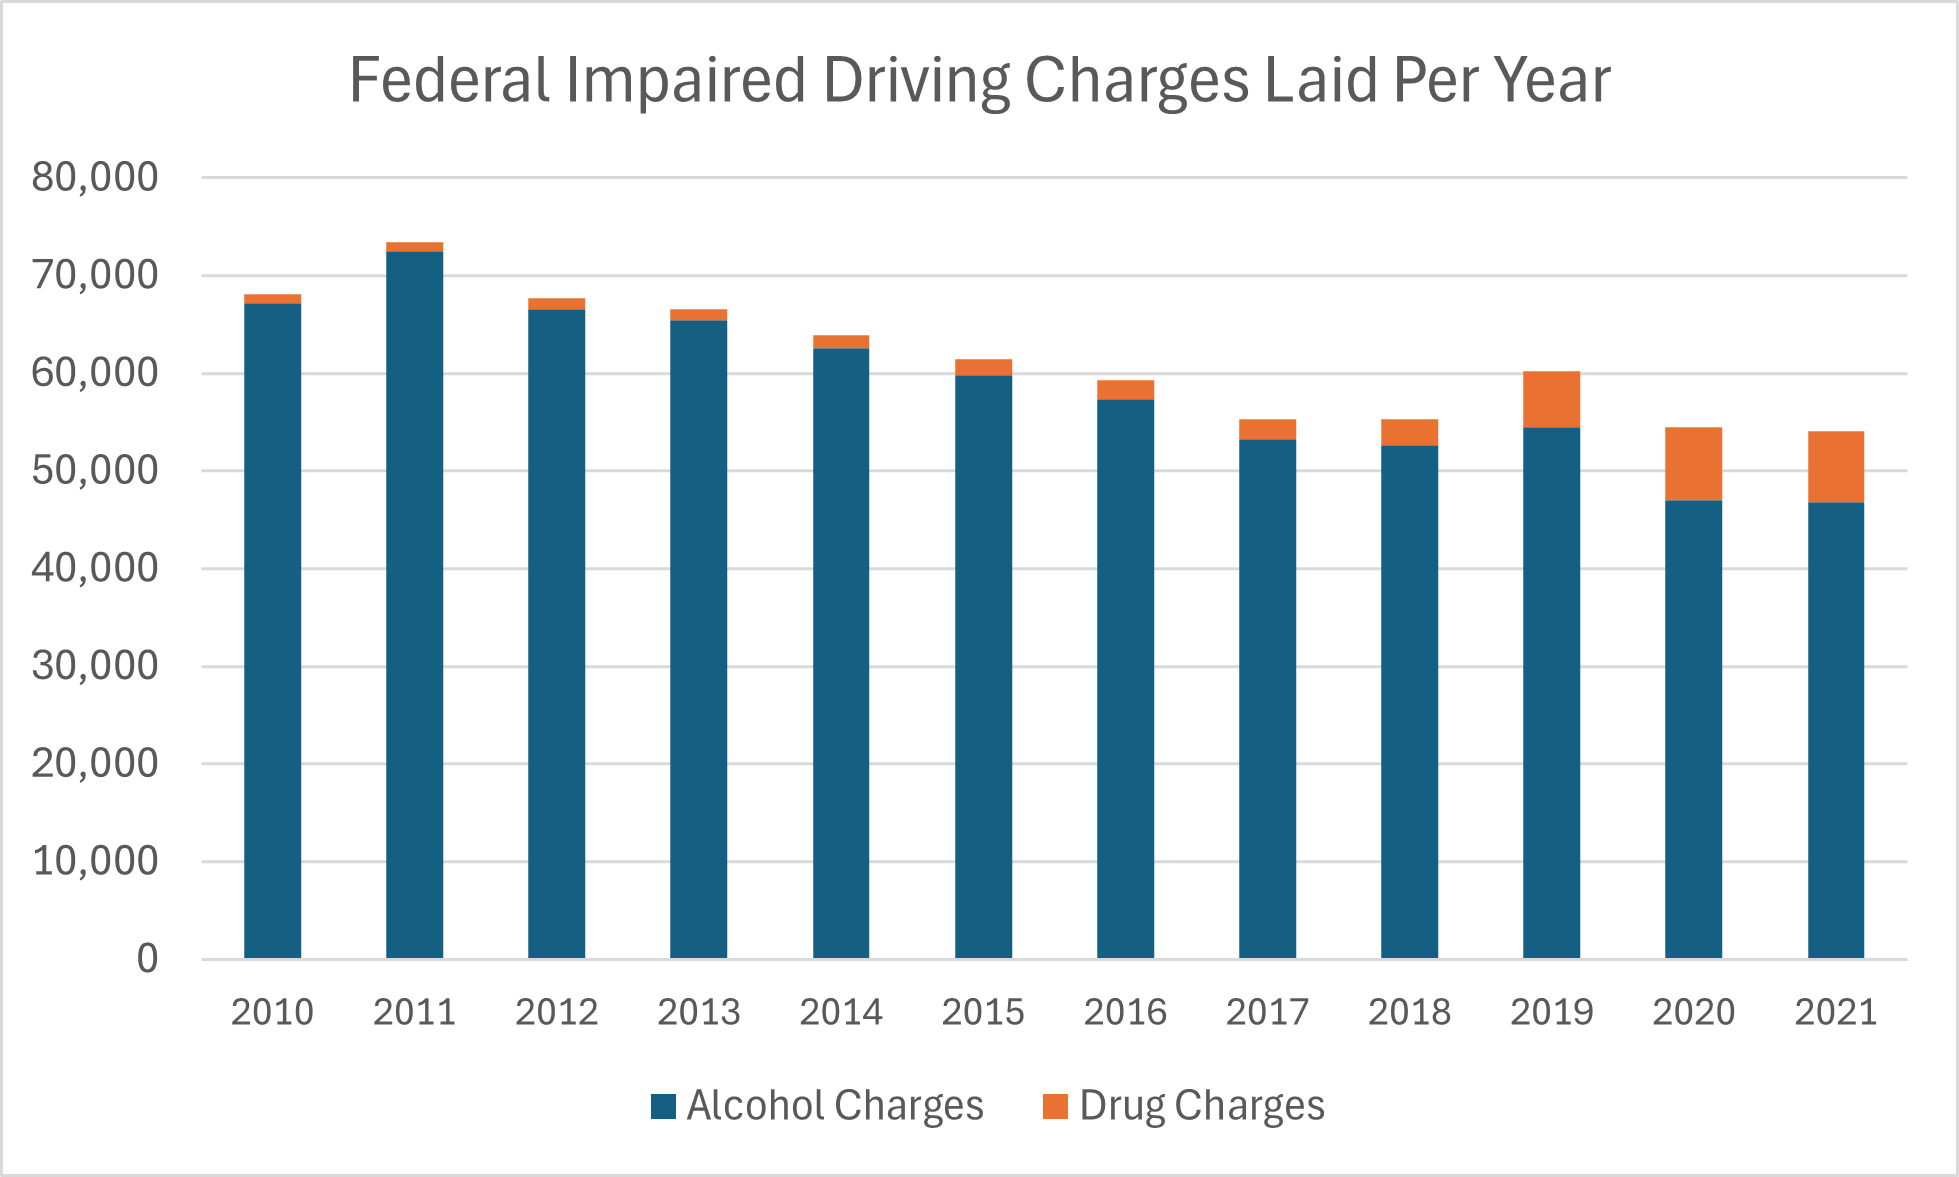
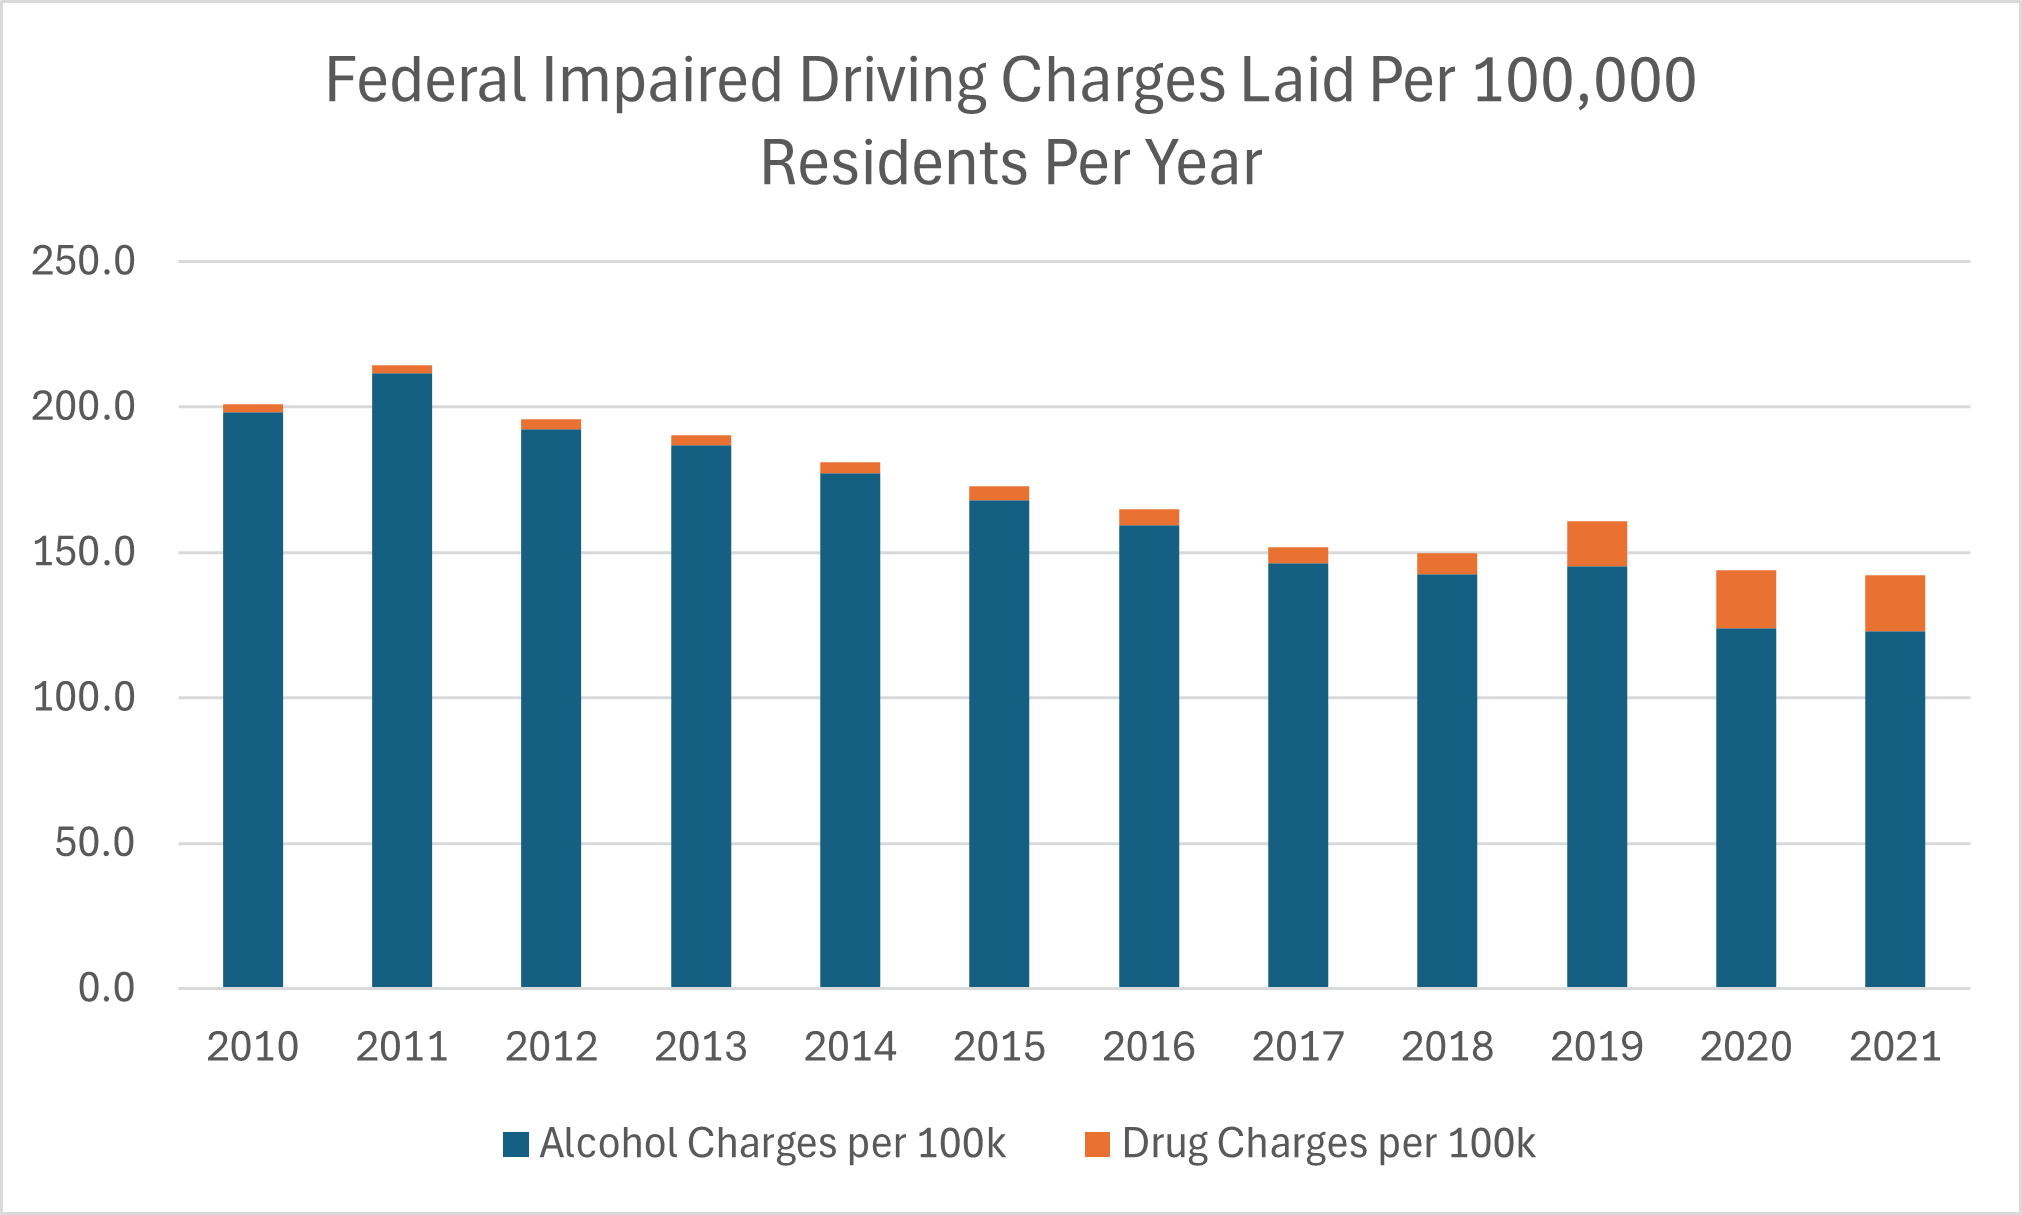
- From 2010 to 2018, the number of federal alcohol-impaired driving charges per year declined by 21.7%. However, there was an uptick in alcohol-impaired driving charges in 2019, probably reflecting (at least in part) the imposition of mandatory alcohol screening (MAS) of drivers that year. MAS efforts were cut back during the COVID-19 pandemic years of 2020 and 2021, which is one reason that alcohol-impaired driving charges declined again. (Another reason may simply be that fewer drivers were on the roads during the height of the pandemic.) As a result, the number of alcohol-related driving charges in 2021 was 30.3% below the number in 2010. The number of alcohol charges per 100,000 population in 2021 was 38.0% lower than in 2010. See the following two charts. (MADD Canada, March 2023)
- In 2021, police laid about 78,480 total charges and short-term suspensions for alcohol- or drug-impaired driving. This represented an average of 215 impaired-driving charges and suspensions per day, and an average rate of 206 impaired-driving charges and suspensions per 100,000 Canadians. (MADD Canada, accessed June 2025)
- In 2023, police reported 71,602 incidents of impaired driving, an average rate of 179 impaired-driving incidents per 100,000 population. These figures represent the fourth annual decline and the lowest rate in history. (In 2001, for example, there were 267 impaired-driving incidents per 100,000 people.) In 2023, there were 48 deaths from alcohol-impaired incidents, 5 deaths from drug-impaired incidents, and 9 deaths from incidents involving a combination of alcohol and drugs. (Statistics Canada, December 2024)
- In 2023, driving while impaired or under the influence was a contributing factor in 21.9% of fatal collisions. Also see the section General Driving-Related Injuries and Fatalities.
- In 2017, 298 pedestrians were fatally injured in crashes on Canada’s public roads. 165 (55.4%) of these pedestrians were tested for blood alcohol content. 30.2% of these 165 pedestrians tested positive for alcohol. 25.4% of the pedestrians had blood alcohol concentrations (BACs) above 0.08% (the legal limit). 21.8% of the pedestrians had BACs above 0.16%. (Canadian Council of Motor Transport Administrators, January 2022)
- In 2021, 391 Canadians were killed in alcohol-related traffic crashes, accounting for 26.5% of all fatal crashes that year. (Traffic Injury Research Foundation, December 2023)
- Alcohol-impaired driving most often occurs on weekends (47% of incidents) and between 11 p.m. and 4 a.m. In contrast, research has shown that although 28% of drug-impaired driving incidents occurred between 11 p.m. and 4 a.m., an equal proportion of incidents occurred between 6 p.m. and 11 p.m. Less than one-third of drug-impaired driving incidents occurred on weekends. (Traffic Injury Research Foundation, 2017)
- Between 2000 and 2014, the total number of traffic fatalities declined by 34.7%, whereas the number of alcohol-related fatalities declined by 40.8%. Evidently, a true decrease in fatalities caused by impaired driving occurred. (Traffic Injury Research Foundation, 2018)
- In 2014, 16.4% of alcohol-positive drivers who were killed in traffic crashes had a blood alcohol concentration (BAC) over 0.16%, which is over twice the legal limit in Canada. 7.3% of the alcohol-positive drivers who were killed had BACs between 0.081% and 0.160%. (Traffic Injury Research Foundation, 2018)
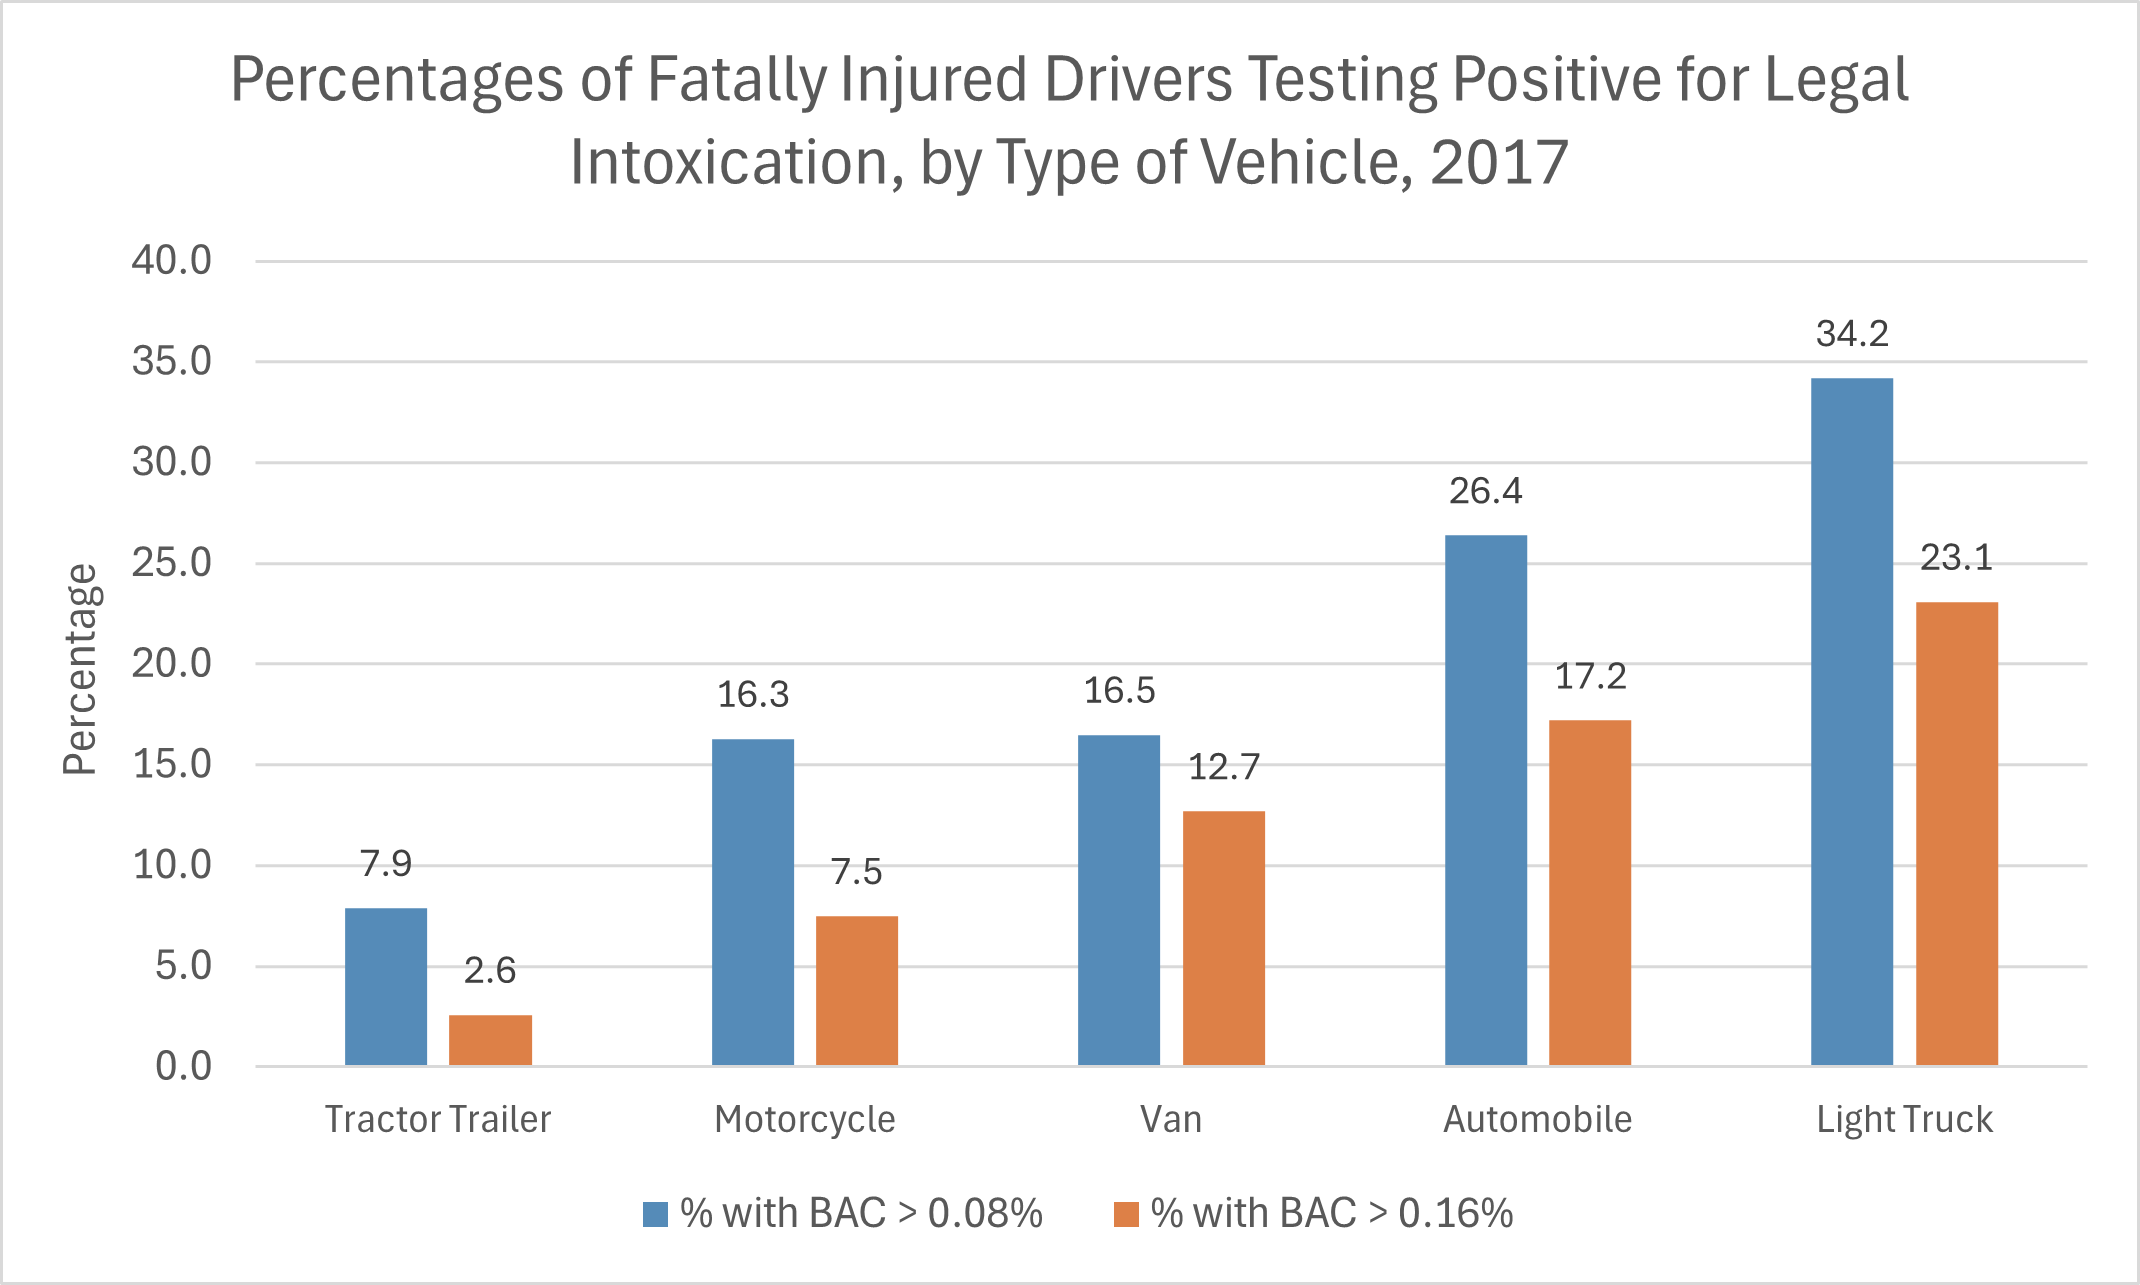
- In 2017, the percentages of fatally injured drivers who tested positive for legal alcohol intoxication varied by the type of vehicle as shown in the following chart. Fully one-third of fatally injured drivers of light trucks and one-quarter of car drivers had a blood alcohol concentration (BAC) greater than 0.08% (which is the legal BAC limit). Nearly one-quarter of fatally injured drivers of light trucks had a BAC at least twice the legal limit. (Canadian Council of Motor Transport Administrators, January 2022)
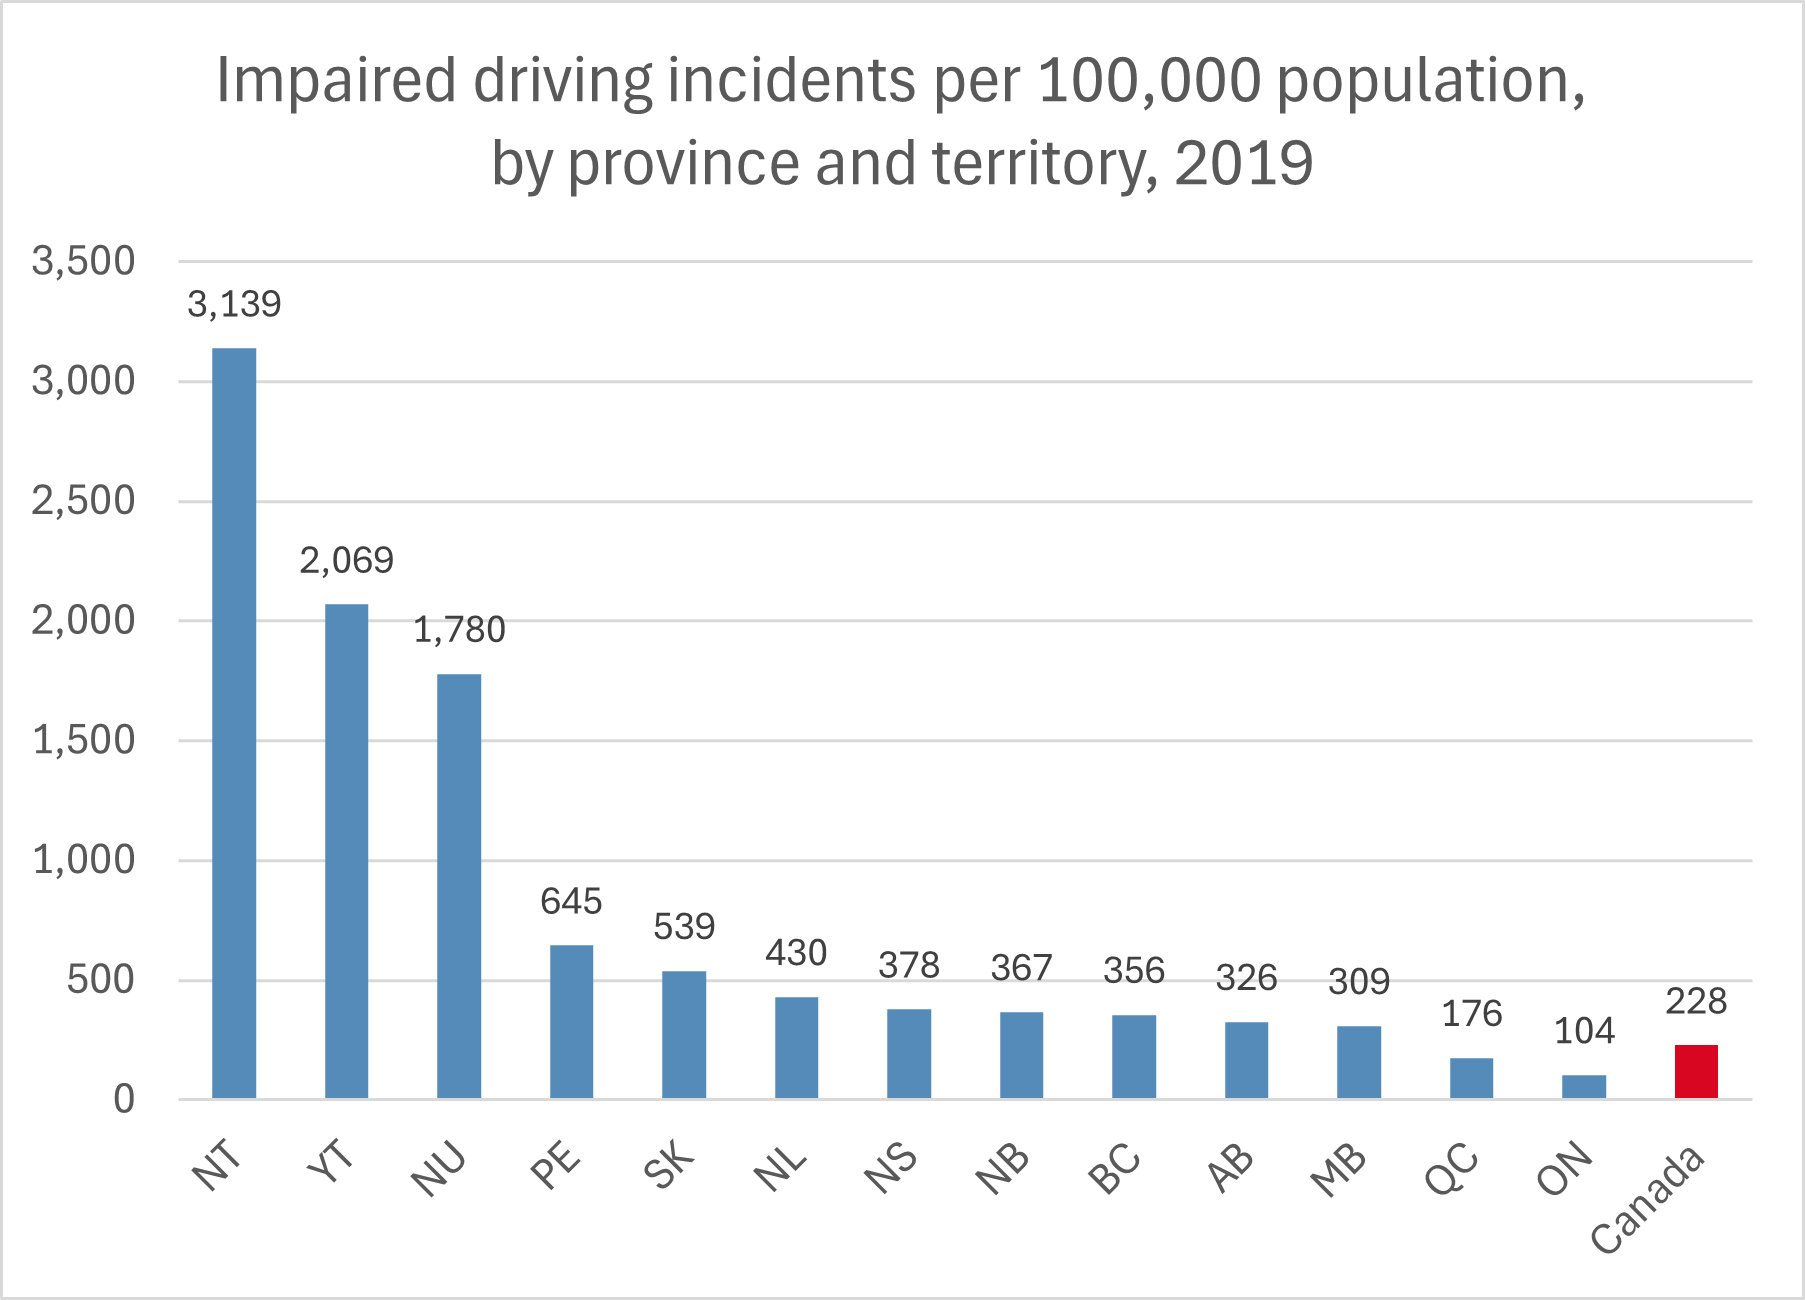
- The following chart lists the rates of police-reported impaired driving incidents per 100,000 population for each province and territory and Canada as a whole. (For this chart, “impaired driving incidents” include alcohol, drugs, both alcohol and drugs, and unspecified substances.) The three territories had the highest impaired driving rates by far; far higher than the rate of Prince Edward Island, which had the highest impaired driving rate among the provinces. Ontario had the lowest impaired driving rate. (Statistics Canada, July 2021)
- In 2022, motor vehicle crashes were the leading cause of death for young drivers from 15 to 24 years of age. (MADD Canada, accessed June 2025)
- In 2016, 16- to 25-year-olds made up nearly 13% of the population but nearly 27% of the alcohol-related traffic deaths. (MADD Canada, accessed June 2025)
- In 2017, nearly 25% of 16–19 year olds and nearly 45% of 20–25 year olds who were fatally injured in motor vehicle crashes where alcohol use was known, died in alcohol-related crashes. (MADD Canada, accessed June 2025)
- In nearly two-thirds of the alcohol-related multiple-vehicle crashes, it was the fatally injured teen driver who had been drinking and not the other drivers. (MADD Canada, accessed June 2025)
- Males account for 87% of the young fatally injured drinking drivers and 89% of the young seriously injured drinking drivers. (MADD Canada, accessed June 2025)
Drug-Impaired Driving Statistics
- From September 2016 to September 2018 (before cannabis was legalized), roadside surveys of drivers in British Columbia, Manitoba, Ontario, Yukon, and Northwest Territories from 11 p.m. to 3 a.m. found that 12.4% of the drivers tested positive for drugs. Tetrahydrocannabinol (THC), the psychoactive ingredient in cannabis, was the most frequently identified drug: 72.9% of the drug-positive drivers tested positive for THC. 31.3% of the drug-positive drivers tested positive for stimulants (such as cocaine or methamphetamine). 11.5% of the drug-positive drivers tested positive for opioids (such as fentanyl or oxycodone). 15.7% of the drug-positive drivers tested positive for more than one drug, and 6.2% of the drug-positive drivers also tested positive for alcohol. (Canadian Council of Motor Transport Administrators, September 2019)
- In 2024, the Canadian Cannabis Survey (performed annually) asked 11,666 Canadian residents ages 16 and older whether using cannabis impairs one’s driving abilities. 86% of the respondents said that it did (compared with 81% in 2018). So did 79% of the 3,052 respondents who used cannabis (compared with 61% in 2018).
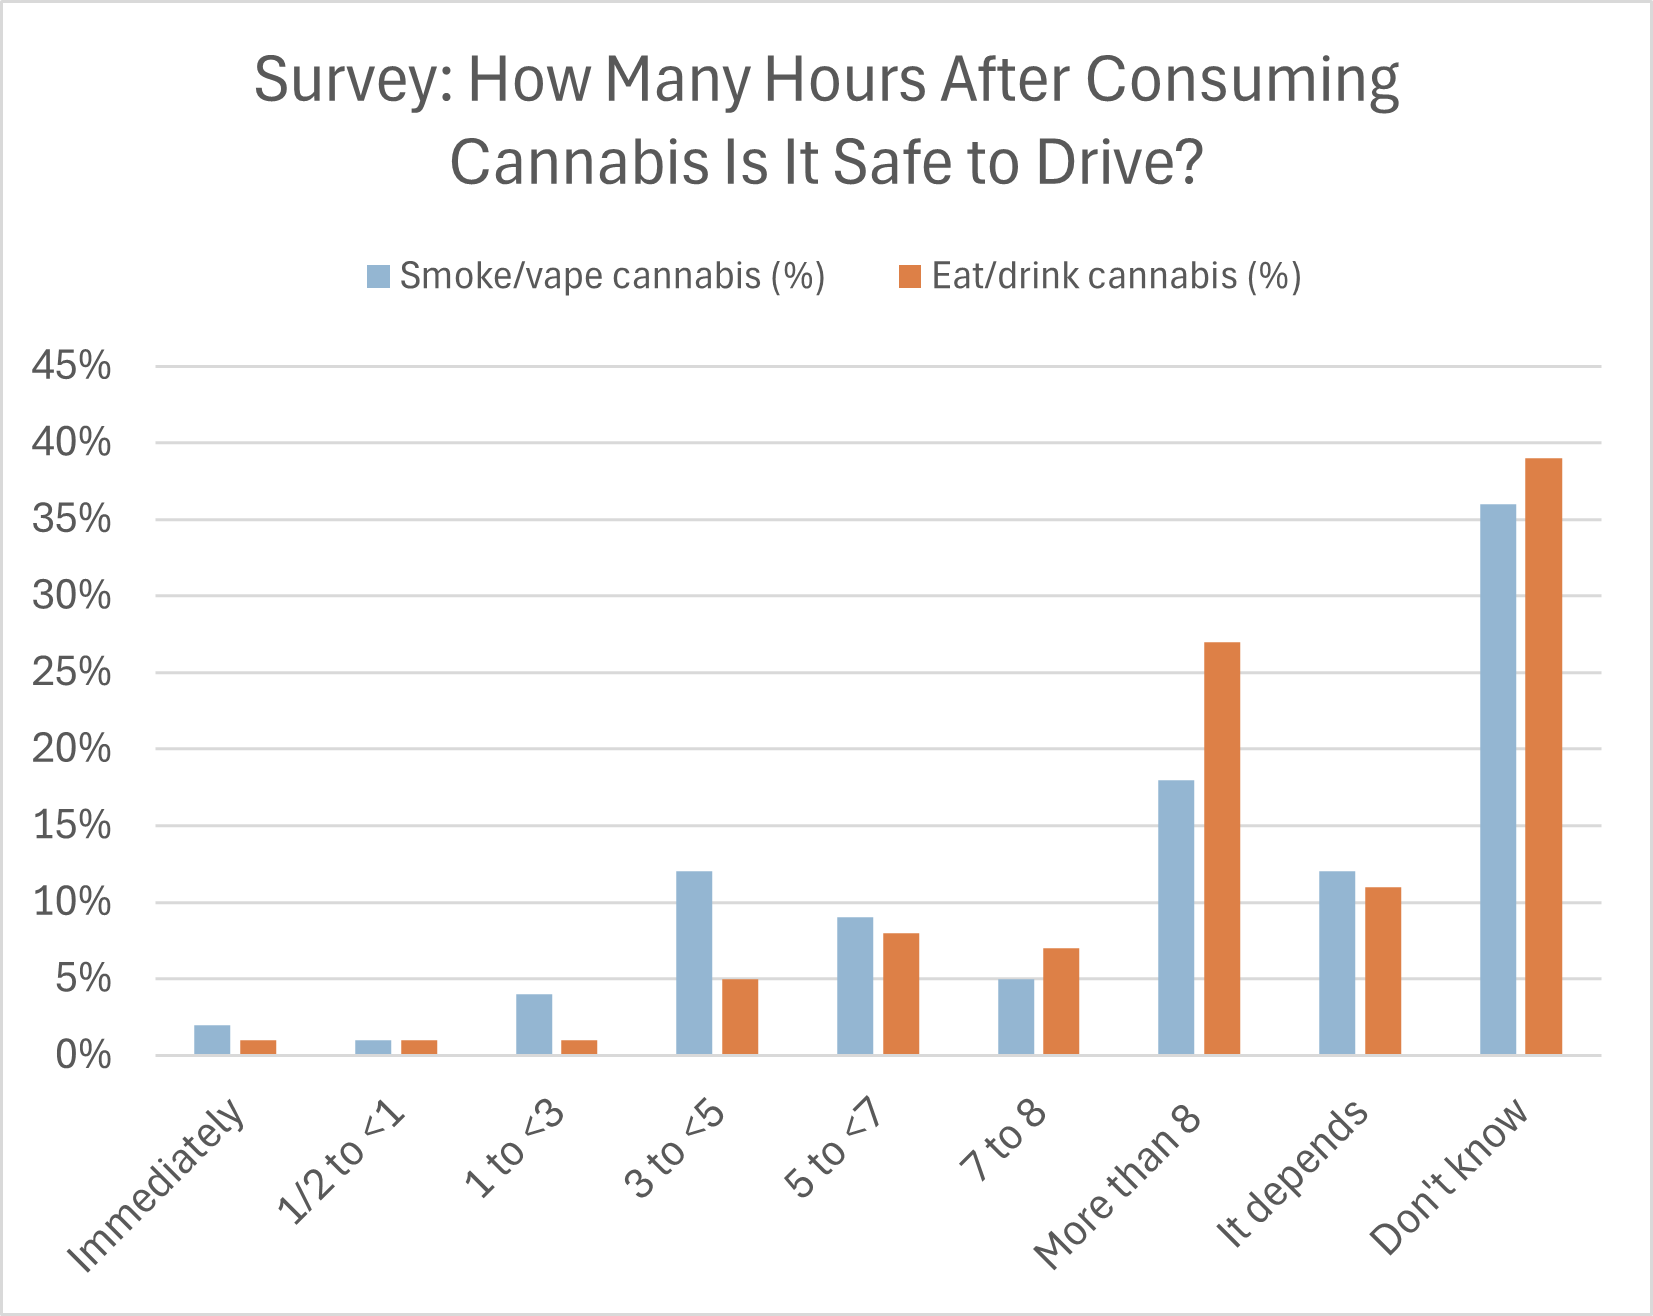
- This survey then asked the 11,666 residents how long after consuming cannabis (by smoking/vaping or eating/drinking) it would be safe to drive. About half of respondents did not venture a numerical answer. A plurality of respondents (36% for smoking/vaping cannabis, 39% for eating/drinking cannabis) said they didn’t know. Another 12% for smoking/vaping and 11% for eating/drinking said “It depends.” The most frequent numerical answer was “More than 8 hours.” Only 3% for smoking/vaping and 2% for eating/drinking said it would be safe to drive in less than an hour. See the following chart. (Health Canada, December 2024)
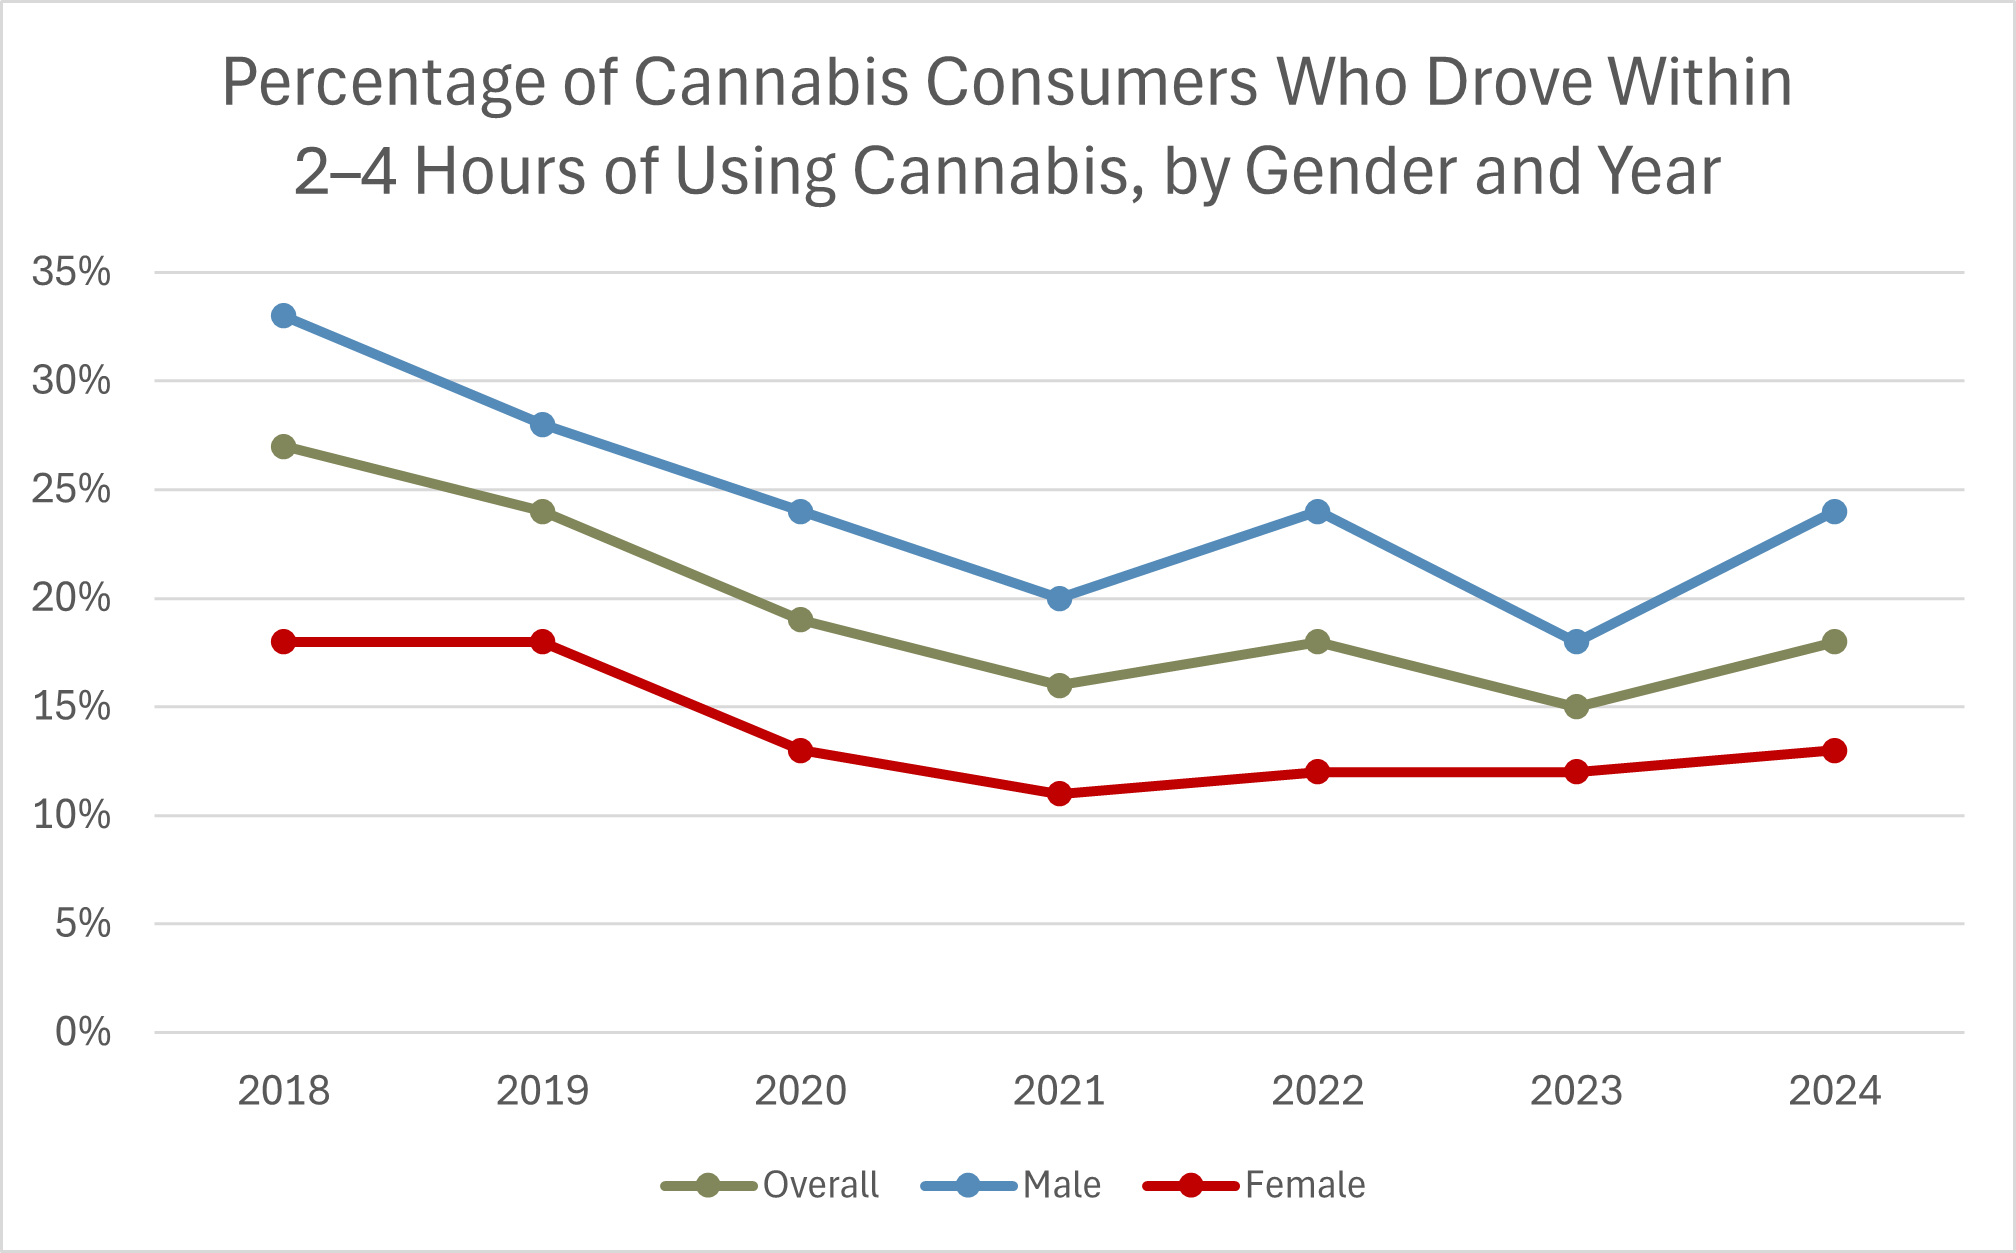
- Nevertheless, that same survey asked the 3,052 users of cannabis ages 16 and older whether they had driven within 2 hours of smoking or vaping cannabis, or within 4 hours of eating/drinking cannabis, within the previous 12 months. 18% of respondents (24% of males, 13% of females) admitted that they had. These three figures represented significant declines from 2018 levels despite significant increases in users overall and male users from 2023 levels. See the following chart. (Health Canada, December 2024)
- From 2010 to 2021, the number of federal drug-related impaired driving charges laid increased steadily each year as laws against drug-impaired driving were enforced. In 2010, there were 925 drug-impaired driving charges; in 2021, there were 7,308, representing a 690.1% increase and a 602.9% increase per 100,000 population. Also see the section Alcohol-Impaired Driving Statistics. (MADD Canada, March 2023)
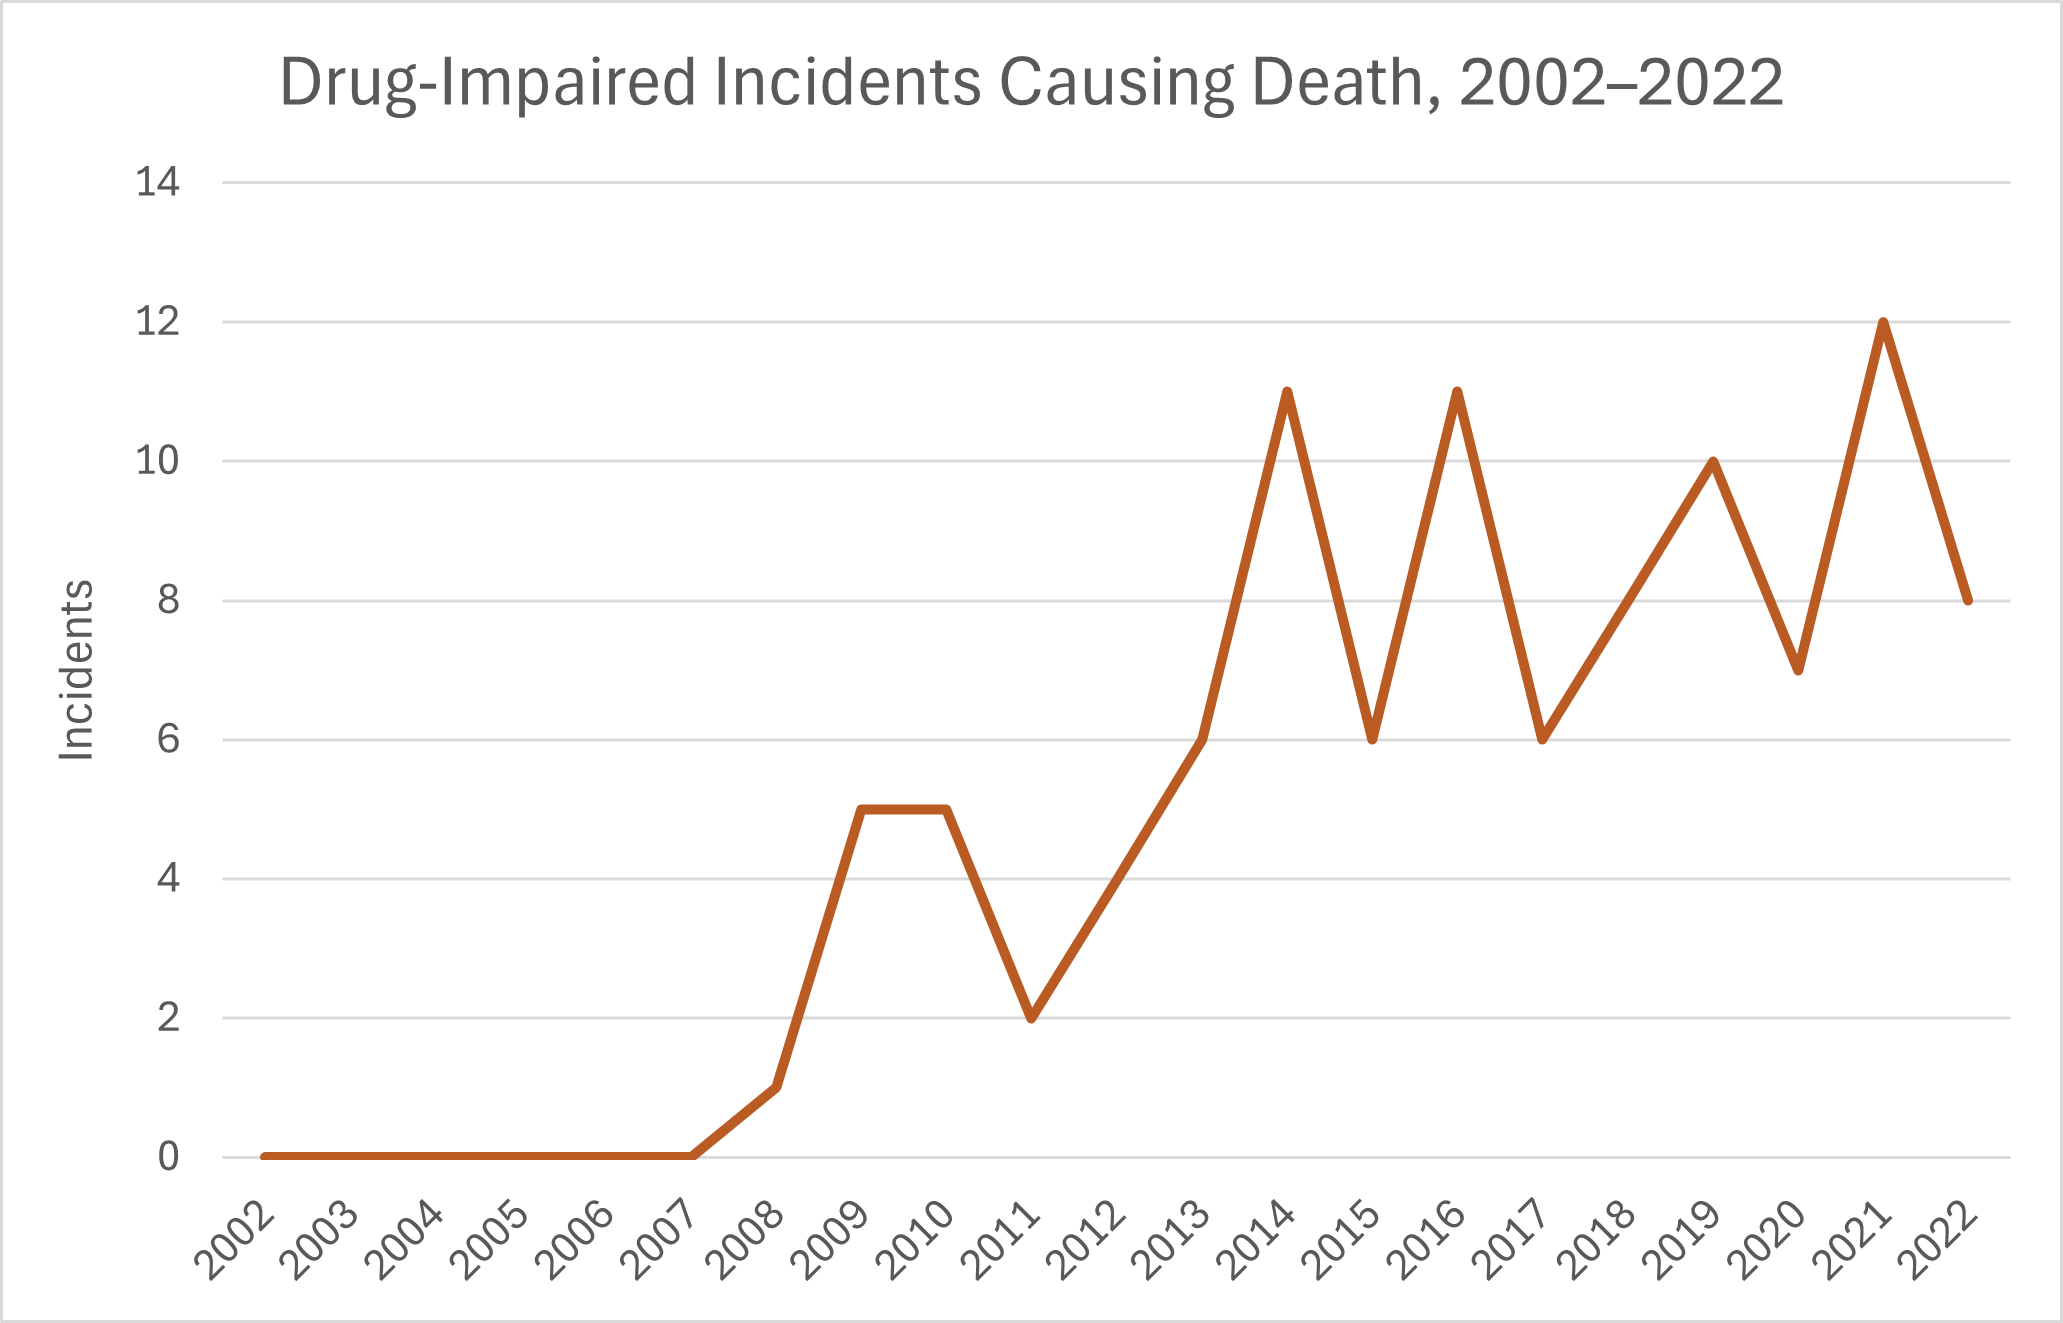
- The following chart shows the numbers of drug-impaired driving incidents causing fatalities from 2002 through 2022. This raw data suggests an uptrend during this period. However, this data should be interpreted with caution. The numbers are quite low (especially when compared to alcohol-impaired fatal incidents), and their standard error (2.08) is relatively high for the raw numbers. Also, during this period, there were several changes made to how incidents were reported to the national Uniform Crime Reporting (UCR) Survey. (Statistics Canada, accessed June 2025)
- According to a CAA poll of 1,517 younger Canadians (i.e., those aged 18–34) in November–December 2019:
- 26% of respondents said they had driven after consuming cannabis or been a passenger in a vehicle whose driver had consumed cannabis.
- 86% of respondents understood the need to seek alternative transportation after consuming alcohol, but only 70% believed it was necessary after consuming cannabis. (CAA, December 2020)
- It is an offence under the Criminal Code to drive under the influence of drugs or under the influence of both drugs and alcohol. Currently, the specific offences and penalties are as follows. (Tetrahydrocannabinol, or THC, is the main psychoactive ingredient in cannabis.)
- At least 2 ng (nanograms) but less than 5 ng of THC per ml (milliliter) of blood within 2 hours of driving: a maximum fine of $1,000
- 5 ng or more of THC per ml of blood: mandatory minimum penalties of a $1,000 fine for a first offense, 30 days’ imprisonment for a second offense and 120 days’ imprisonment for a third offense
- At least 2.5 ng of THC together with a blood alcohol concentration (BAC) of 0.05%: same mandatory minimum penalties as above
- Any detectable level of cocaine, methamphetamine, LSD, etc.: same mandatory minimum penalties as above
- Provinces and territories may impose their own penalties as well, such as an administrative licence suspension even before the driver has been found guilty of the offence.
- 50 mg of diphenhydramine (a popular over-the-counter antihistamine) can impair your driving more than a blood alcohol concentration (BAC) of 0.10% (which exceeds the threshold for legal intoxication). (University of Iowa, 2000)
Illness-Impaired Driving Statistics
- Studies have shown that the common cold can slow a driver's reaction time by about 10% and make it significantly less likely that the driver will be able to identify moving objects that may cause a collision. This level of impairment is roughly comparable to the effects of a blood alcohol concentration (BAC) of 0.08% (which constitutes legal intoxication). These effects do not include possible additional driving impairment from medications taken to treat the common cold. (Cardiff University, 2012)
- A literature-review study investigated the effects of common chronic health conditions on estimated driving performance. Some of the findings are summarized in the following table. The crash risk odds ratio of a health condition is the factor by which the crash risk is multiplied, compared with not having the condition. For example, an odds ratio of 2.00 would mean that the health condition doubles the sufferer’s crash risk. Most of these health conditions have a range of odds ratios, depending on the severity of the condition or the age of the patient. Some odds ratios were calculated to two decimal places, but others to only one. These health conditions tend to be more prevalent in older people, which is concerning as the US population ages. (Lococo, K. H. et al., July 2018)
|
Health Condition |
Crash Risk Odds Ratio |
|
Arthritis (unrestricted drivers) |
1.59 – 4.51 |
|
Cataracts |
2.5 – 2.7 |
|
Dementia |
2.00 – 4.23 |
|
Glaucoma |
3.60 – 6.0 |
|
Hepatic encephalopathy |
4.51 – 5.77 |
|
Hypoglycemia caused by diabetes or diabetes medications |
1.04 – 3.24 |
|
Macular degeneration |
3.3 |
|
Multiple sclerosis with cognitive impairment |
9.1 |
|
Obstructive sleep apnea |
1.30 – 6.3 |
|
Parkinson’s disease |
1.42 – 7.5 |
|
Stroke or transient ischemic attack (TIA) |
2.7 |
In comparison, the crash risk odds ratio of a blood alcohol concentration (BAC) of 0.08% is 2.7 – 4.5.
Drowsy Driving Statistics
- According to data from Australia, England, Finland, and other European nations, all of whom have relatively consistent crash reporting procedures, drowsy driving is a contributing factor in 10–30% of all crashes. (Arrive Alive, 2025)
- In a survey of 750 Ontario drivers in 2006, 14.5% of the respondents admitted that they had fallen asleep or “nodded off” at least once while driving during the past year. 2% of the respondents admitted that they had been involved in a fatigue-related or drowsiness-related collision within the past year. (Traffic Injury Research Foundation, October 2007)
- In a 2011 survey of Canadian drivers, 18.5% of drivers admitted to nodding off or falling asleep at the wheel in the past year. 14% of drivers admitted to often driving fatigued. (Traffic Injury Research Foundation, March 2021)
- In a 2004 survey of Canadian drivers, 28% of drivers aged 16–19 and 35% of drivers aged 20–24 reported nodding off while driving. (Traffic Injury Research Foundation, 2012)
- According to the Canadian Council of Motor Transport Administrators, 21% of all collisions are caused by driver fatigue.
- According to a Canadian Association of Chiefs of Police report, 20% of fatal collisions are caused by drowsy drivers. (Carsurance.net, 2020)
- From 2010 to 2016, the rates of fatigue-related fatalities and non-fatigue-related fatalities per 100,000 population both decreased, but the rate of non-fatigue-related fatalities declined both faster and more steadily. The rate of fatigue-related fatalities declined from 0.35 persons per 100,000 population in 2010 to 0.25 persons per 100,000 population in 2016, a decline of 28.6%. The rate of non-fatigue-related fatalities declined from 7.2 persons per 100,000 population in 2010 to 3.51 persons in 2016, a decline of 51.2%. Also, the rate of fatigue-related fatalities significantly increased twice to local peaks in 2002 and 2011 before falling to its 2016 value. (Traffic Injury Research Foundation, March 2020)
- In 2012–2016, 6.4% of fatally injured male drivers were fatigued, compared with 4.3% of fatally injured female drivers. (Traffic Injury Research Foundation, March 2020)
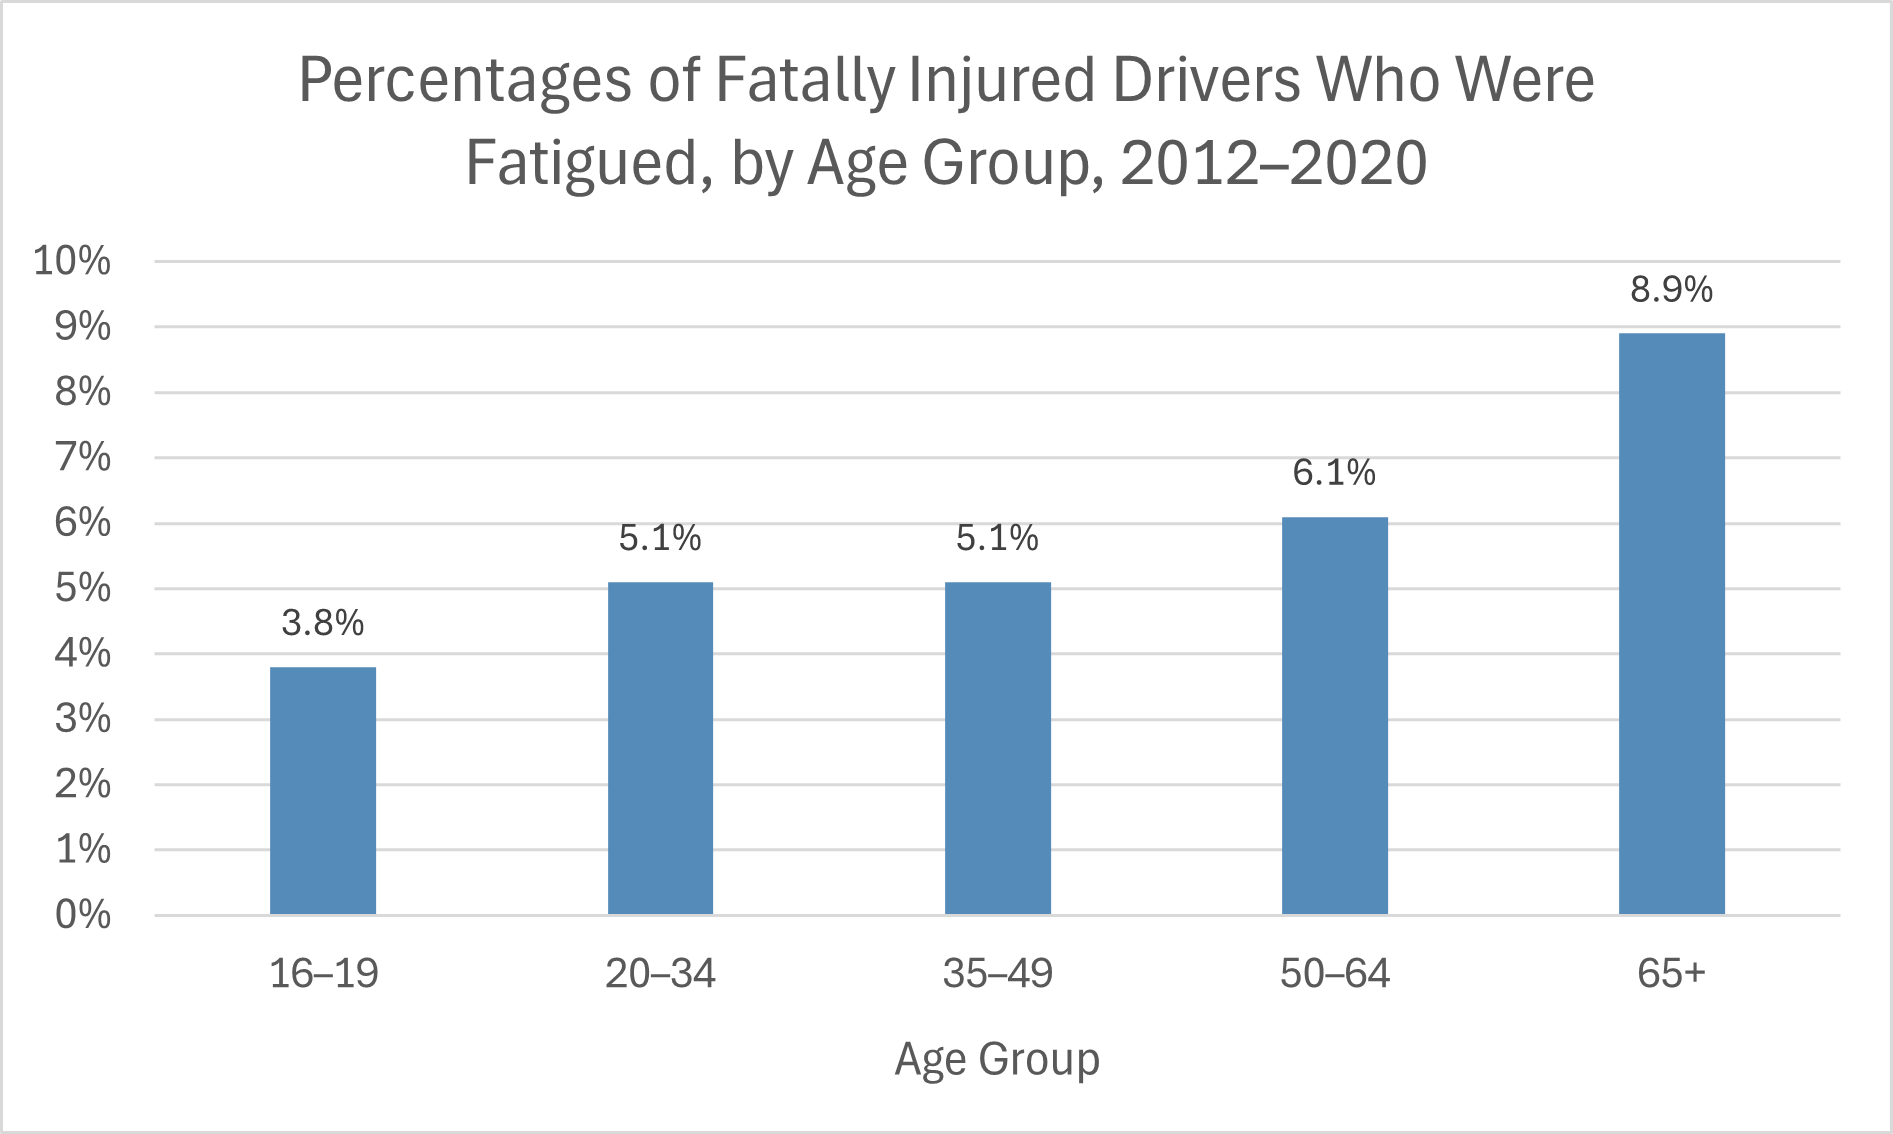
- Among drivers killed in accidents from 2012 through 2016, the prevalence of fatigue tended to increase with increasing age. Fatigue was involved in just 3.8% of fatally injured drivers aged 15–16 but 8.9% of fatally injured drivers aged 65 and older. See the following chart. (Traffic Injury Research Foundation, March 2020)
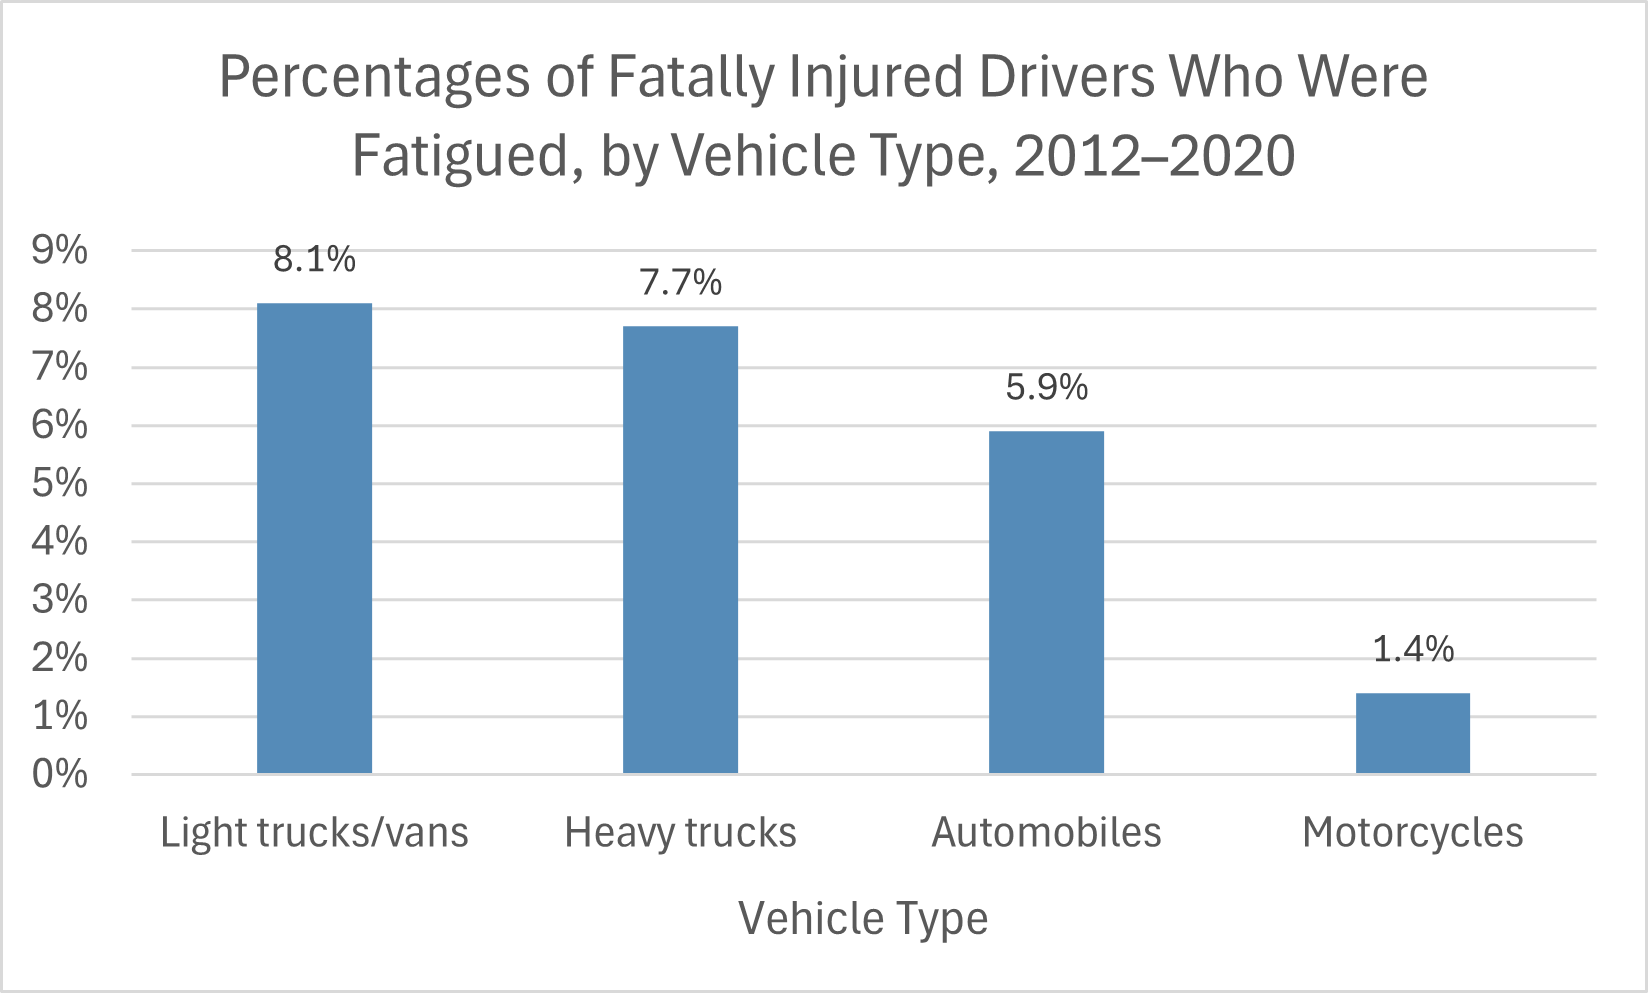
- In 2012–2016, the prevalence of fatigue among fatally injured drivers also varied by vehicle type. Fatigue was more prevalent among drivers of vans and light trucks and less prevalent among motorcycle operators. See the following chart. (Traffic Injury Research Foundation, March 2020)
- According to the official figures for 2023, fatigue was a contributing factor in 3.3% of fatal collisions in Canada. However, this figure is likely a significant underestimate. The lack of an objective scientific test of fatigue makes it very difficult to determine whether a fatally injured driver was fatigued at the time of the crash. The official figures from Australia and several European nations would tend to suggest that much higher percentages of fatal crashes involve driver fatigue.
- In 2012–2016, fatigue was a factor in 10.2% of road fatalities from 6:00 a.m. to 8:59 a.m., more than for any other three-hour period of the day. A close second was the period 3:00 a.m. to 5:59 a.m., during which 10.0% of fatalities were fatigue related. However, only 3.2% of fatalities from 9:00 a.m. to 11:59 a.m. were fatigue related. (Traffic Injury Research Foundation, March 2020)
- Being awake for 18 hours straight can impair driving as much as a blood alcohol concentration (BAC) of 0.05%. Being awake for 24 hours straight can impair driving as much as a BAC of 0.10%. (In Canada, the legal limit for BAC is under 0.08%.) (National Sleep Foundation, 2018)
- Drivers missing 2–3 hours of sleep in 24 hours more than quadrupled their risk of a crash compared with drivers getting the recommended seven hours of sleep. (AAA Foundation for Traffic Safety, 2016)
- If a driver falls asleep for just four seconds while travelling at a speed of 100 km/h (62 mph), the vehicle will travel 111 meters (364 feet) without a driver in control. (The length of a US football field including the two end zones is 360 feet.) (Transport Accident Commission, 2018)
- Driving while sleepy can make a driver approximately two-and-a-half times as likely to have a motor vehicle accident. (Sleep, Journal of the Sleep Research Society, 2017)
- Drivers who get only five or six hours of sleep in 24 hours nearly double their risk of a crash. (AAA Foundation for Traffic Safety, 2016)
- Currently, there are no laws in Canada specifically against driving while drowsy. However, a driver who falls asleep at the wheel might be charged with other offences, such as dangerous operation of a vehicle. (CBC, September 2020)
Teen Accident Statistics
- Most traumatic injuries to Canadians aged 15–19 are caused by car crashes. (Desjardins Insurance, 2020)
- Young Canadians represent 13% of the licensed driving population but account for 20% of motor vehicle deaths and injuries. (Desjardins Insurance, 2020)
- In 2021, 94 persons aged 15–19 were killed in road crashes. 9,399 were injured, of whom 728 were injured seriously enough to require hospitalization. About 75% of these deaths and about 85% of these injuries occurred to teens as motor vehicle drivers, motor vehicle passengers, or motorcyclists. The rest of the deaths and injuries occurred to them as pedestrians or bicyclists, or were not stated. (Transport Canada, April 2023; Canada National Collision Database, accessed June 2025)
- Until 2020, the rates of fatalities per 100,000 population for drivers aged 15–19 and 20–24 had exceeded the rates for all other age groups under age 65. In 2020, those rates dropped sharply, probably because fewer young people were on the road as a consequence of the COVID-19 pandemic. Nevertheless, the fatality rate for drivers aged 20–24 still exceeded the rates for all other age groups that year. See the following chart. (Parachute, October 2023)
- A study of vehicle crashes in Canada from 1990 to 2012 found that persons aged 16 to 25 made up 13.6% of the population but 27.2% of all motorcyclist fatalities. (Vanlaar et al., Journal of Safety Research, September 2016)
- A study of vehicle crashes in Canada from 1990 to 2012 found that persons under 16 years of age made up 19.5% of the population but 23.3% of all bicyclist fatalities. (Vanlaar et al., Journal of Safety Research, September 2016)
- During the period 2017–2021, the most common types of collisions for drivers aged 15–19 were rear-end collisions (26.1% of all teen driver collisions), right-angle collisions (12.4%), left turn against oncoming traffic (9.0%), running off the right shoulder (7.3%), and running off the left shoulder (5.0%). (Canada National Collision Database, accessed June 2025)
- A naturalistic driving study of 52 young drivers aged 16–18 with intermediate (provisional) licences was performed from February 2008 to February 2010. The study found that these drivers were six times as likely to have a serious accident when there was loud conversation with passengers in the vehicle. (Foss and Goodwin, May 2014)
- When a teen driver is carrying a passenger, the risk of a fatal car crash doubles. If two or more passengers are present, the odds are five times as likely. (TeenSafe, 2018)
Senior Accident Statistics
- In the European Union, persons aged 75 or older have a greater risk of severe injury or death in every mode of transport, including driving. (EU Mobility & Transport, January 2021)
- In the European Union in 2023, 31% of road crash fatalities were 65 years of age or older, compared with just 17% in 1992. This percentage is nearly as great as the 32% of fatalities aged 25–49 in 2023. Specifically, 28% of car occupant fatalities in 2023, 51% of pedestrian fatalities, 50% of cyclist (bicyclist) fatalities, 24% of moped fatalities, and 9% of motorcyclist fatalities were aged 65 or older. (European Road Safety Observatory, February 2025)
- In the Netherlands, the fatality rate per billion kilometres travelled for car drivers aged 75 or older is more than 5 times higher than the average for all ages. The fatality rate for cyclists aged 75 or older is 12 times higher than the average for all ages. (EU Mobility & Transport, 2019)
- In the European Union in 2022, 29% of all road fatalities among seniors (persons aged 65 or older) were as pedestrians, compared with just 13% of persons under 65. On the other hand, just 7% of fatalities among seniors were as operators of powered two-wheeled vehicles (such as mopeds and motorcycles), compared with 24% of persons under 65. These figures probably reflect seniors’ relatively cautious driving behaviour and relatively high vulnerability to injury. (European Road Safety Observatory, March 2024)
- In the European Union in 2022, 24% of road fatalities among seniors occurred at intersections, compared with 16% of road fatalities among younger persons. (European Road Safety Observatory, March 2024)
- In the European Union in 2023, 4,238 (68.1%) of the 6,220 road fatalities aged 65 and older were male, and 31.9% were female. (European Road Safety Observatory, March 2024)
- In Canada in 2023, there were 5,870,535 licensed drivers aged 65 and older, making up 20.5% of all licensed drivers. 3,022,495 (51.5%) of these licensed senior drivers were male, 2,848,022 (48.5%) were female, and just 17 were of other genders. (Canada, National Collision Database, October 2023)
- In Canada in 2021, drivers aged 65 and older suffered the second-highest percentage (20.3% of the total) of driver fatalities and the highest percentage (19.2%) of passenger fatalities of all age groups. Also see the charts in the section Fatalities by Age. (Transport Canada, 2022)
- In the period 2018 to 2020, the rate of pedestrian deaths per 100,000 population increased sharply with advancing age after age 49. The fatality rate for pedestrians aged 40 to 49 was 0.52 per 100,000 population. For pedestrians aged 60 to 69, the rate was 1.12 per 100,000 population – more than twice as high. The fatality rate for pedestrians aged 90 or older was 3.07 per 100,000 population – nearly six times as high. See the following chart. (Statistics Canada, October 2023)
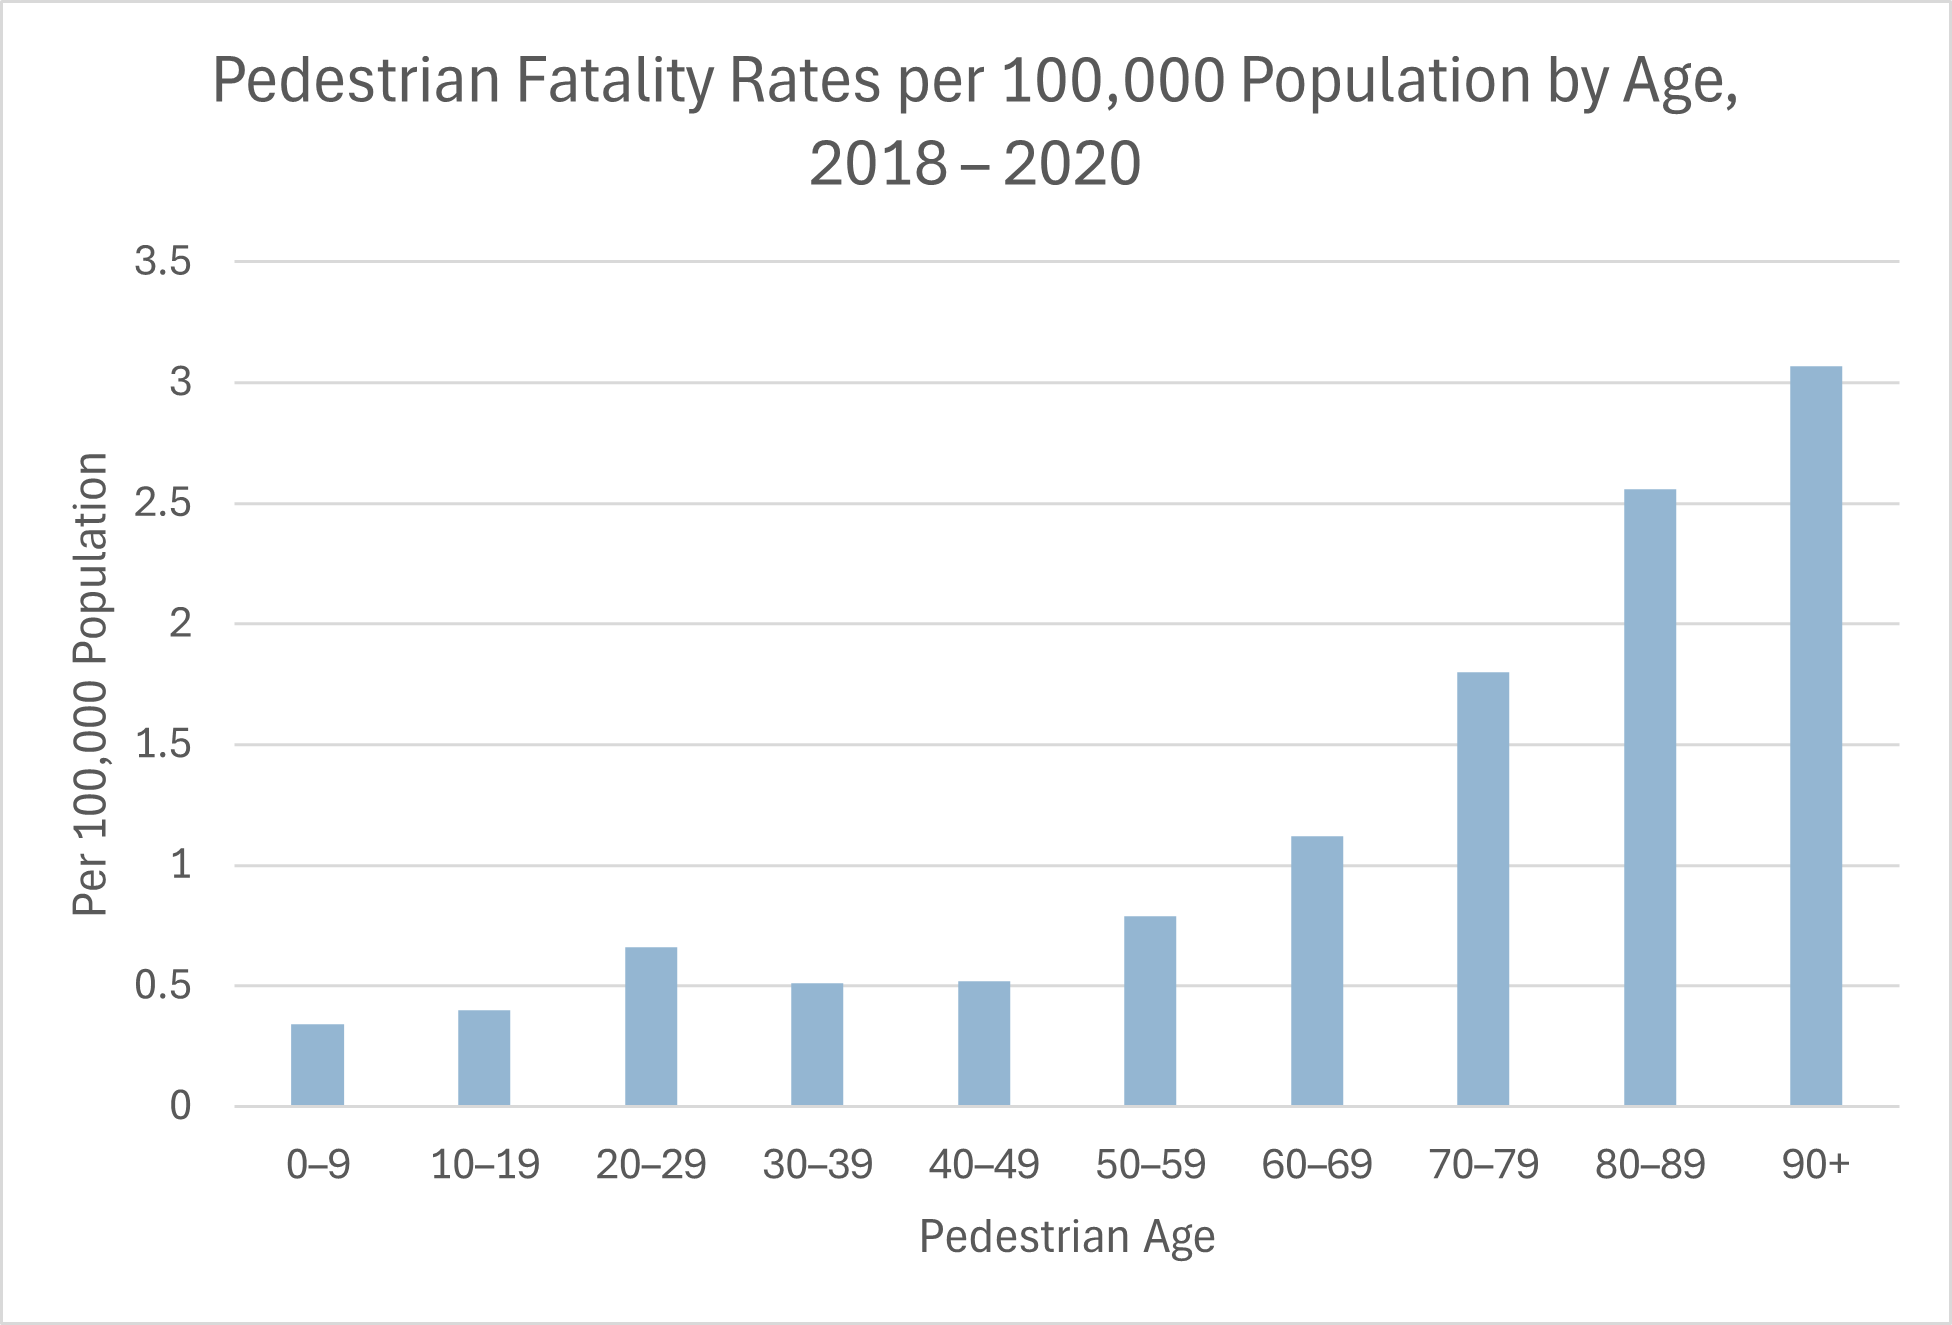
Trucking Statistics
- In 2023, there were 681,523 registered commercial vehicles weighing between 4,536 and 11,793 kg, 576,254 vehicles weighing 11,794 kg or more, and 65,149 buses, for a total of 1,322,926 commercial vehicles of these types. In other words, medium-duty vehicles (GVWR classes 3 through 6) made up about 61.5% of this total, heavy-duty vehicles (classes 7 and 8) made up 43.6%, and buses made up 1.0%. There were also 5,541,771 registered vans, minivans, and cargo vans. (Statistics Canada, October 2024)
- From 2017 to 2022, the numbers of registered commercial vehicles changed as follows: (Statistics Canada, October 2024)
|
Vehicle Type |
2017 |
2023 |
% Change, 2017–2023 |
|
Vans, under 4,536 kg |
1,910,943 |
1,541,771 |
-19.3% |
|
Medium-duty vehicles, 4,536–11,793 kg |
558,490 |
681,523 |
+22.0% |
|
Heavy-duty vehicles, 11,794 kg or more |
532,112 |
576,254 |
+8.3% |
|
Buses |
65,816 |
65,149 |
-1.0% |
- In Canada in 2023, there were 576,254 registered heavy-duty trucks, making up 2.2% of all registered motor vehicles, and 681,523 registered medium-duty trucks, making up 2.7% of all registered motor vehicles. Heavy-duty trucks have a gross vehicle weight rating (GVWR) of 11,794 kg or more (GVWR classes 7 and 8). Medium-duty trucks have a GVWR of between 4,536 and 11,793 kg (GVWR classes 3, 4, 5 and 6). The 65,149 registered buses made up 0.3% of all registered motor vehicles. (Statistics Canada, October 2024)
- In 2018, trucks carried nearly 63.7 million shipments with an average weight of 11.8 tonnes, for an average distance of 597 km per shipment. (Statistics Canada, February 2020)
- For domestic transportation in 2018, 77.7% of the volume of goods transported within Canada was moved by truck, 22.2% was moved by train, and a negligible volume (0.1%) was moved by air. (Library of Parliament, May 2022)
- In 2020, 54.2% of exports to the United States (as measured in dollars) were shipped by truck; 71.5% of imports from the United States were shipped by truck. (Library of Parliament, May 2022)
- In 2022, large trucks travelled an average of almost 230,000 km per year, compared with 16,500 km for passenger vehicles. (Traffic Injury Research Foundation, 2022)
- In 2019, the trucking and logistics sector employed 3.6% of Canada’s total workforce. (Library of Parliament, May 2022)
- In 2023, there were about 145,566 businesses engaged in commercial truck transportation. 53,419 of these businesses had workers on a payroll. The other 92,147 firms may have had contracted workers or family members working there. About 83.2% of the 53,419 employer businesses were micro (fewer than five workers each), 16.4% were small, with between 5 and 99 employees, and 0.4% were medium, with between 100 and 499 workers. In all of Canada, only 11 trucking businesses were identified as large with 500 or more workers each, representing less than 0.01% of all trucking businesses. Ontario was home to more businesses in each of these four size categories than any other province. (Statistics Canada, June 2025)
- By December 2024, the number of trucking businesses in Canada had grown to 152,000 of many types, including small for-hire carriers, owner-operators, and large logistics companies. (Transport Canada, June 2025)
- Canada’s freight transport market is expected to reach USD 42.07 billion by 2025 and USD 51.99 billion by 2030, representing a compound annual growth rate (CAGR) of 4.32%. (Mordor Intelligence, 2025)
- In 2023, the transport and storage sector accounted for 3.2% of Canada’s Gross Domestic Product (GDP). (Mordor Intelligence, 2025)
- From 2012 to 2019, the numbers of collisions, fatalities, and serious injuries involving commercial vehicles declined by 1.1%, 10.2%, and 17.0% respectively. These trends were followed by sharp declines in 2020 and partial recoveries in 2021, probably reflecting the effects of the COVID-19 pandemic on trucking. See the following chart. (Transport Canada, November 2023)
- From 2012 to 2021, the number of registered commercial vehicles increased by 24%, from 1,052,825 to 1,310,063. As a result, the rates of commercial vehicle collisions, fatalities and serious injuries declined by larger percentages than the raw numbers shown in the above chart. In that period, the collision rate per 10,000 commercial vehicles decreased by 36%, from 429 to 275. The fatality rate per 10,000 commercial vehicles decreased by 32%, from 3.8 to 2.6, and the rate of serious injuries per 10,000 commercial vehicles decreased by 43%, from 10.9 to 6.2. (Transport Canada, November 2023)
- Likewise, estimated vehicle kilometres travelled (VKTs) increased by 30%, from 37.7 billion in 2012 to 48.9 billion in 2021. As a result, from 2012 to 2021, the commercial vehicle collision rate per billion VKTs decreased by 38%, from 1,198 to 737; the fatality rate per billion VKTs decreased by 34%, from 10.6 to 7.0; and the serious injury rate decreased by 46%, from 30.5 to 16.6. (Transport Canada, November 2023)
- The years 2020 and 2021 bucked the longer-term downward trends in a few ways. From 2020 to 2021, the collision rate per 10,000 commercial vehicles increased by 3%, and the serious injury rate increased by 4% in 2020 and by 3% in 2021. (None of the rates per billion VKTs increased in that period, because of a sharp increase in VKTs then.) (Transport Canada, November 2023)
- For commercial vehicles from 2012 to 2021, there were 1,281 fatal collisions for straight trucks, 1,919 fatal collisions for tractor-trailers, and 191 fatal collisions for buses. There were 34,756 serious-injury collisions for straight trucks, 27,581 for tractor-trailers, and 12,783 for buses. Tractor-trailers made up the largest share of fatal collisions, but straight trucks made up the largest share of collisions involving serious injury. See the following two charts. (Transport Canada, November 2023)
- In the period 2012–2021, 63% of fatal commercial vehicle collisions were two-vehicle collisions, 20% were single-vehicle collisions, and 17% were collisions involving more than two vehicles. 62% of commercial vehicle collisions involving injury were two-vehicle collisions, 23% were single-vehicle collisions, and 15% were collisions involving more than two vehicles. (Transport Canada, November 2023)
- In the period 2012–2021, the most frequent configurations of fatal commercial vehicle collisions were head-on collisions (30%), right-angle collisions (12%), and rear-end collisions (12%). For commercial vehicle collisions involving injury, the most frequently occurring configurations were rear-end collisions (27%), other single-vehicle collision configurations (11%), and right-angle collisions (10%). (“Other single-vehicle configurations” refers to single-vehicle collisions that do not fit any of the existing categories of single-vehicle collisions such as hitting a moving object, hitting a stationary object, running off the road, or rolling over.) (Transport Canada, November 2023)
- In the period 2012–2021, the most fatal commercial vehicle collisions per month occurred on August, October and November. January was the month with the most injury collisions. The fewest collisions per month of both types occurred in April. See the following chart. (Transport Canada, November 2023)
- In the period 2012–2021, 70% of fatal commercial vehicle collisions and 78% of commercial vehicle collisions involving injury occurred between 6 a.m. and 6 p.m. (Transport Canada, November 2023)
- In the period 2012–2021, most commercial vehicle fatal collisions (74%) occurred on rural roads, while most commercial vehicle injury collisions occurred on urban roads (56%). (Transport Canada, November 2023)
- Of the vehicles involved in fatal commercial vehicle collisions in 2012–2021, 19% were single-unit (straight) trucks, 31% were tractor-trailers and 3% were buses. Of the vehicles involved in injury collisions during that period, 24% were straight trucks, 20% were tractor-trailers and 9% were buses. (Transport Canada, November 2023)
- In the period 2012–2021, more commercial drivers aged 45 to 54 were involved in fatal commercial vehicle collisions than commercial drivers in any other age group. This was true for straight trucks, tractor-trailers and buses. See the following chart. (Canada National Collision Database, October 2023)
- In the period 2012–2021, only about 15% of those killed in commercial vehicle collisions were occupants of the commercial motor vehicle (CMV). Far more were occupants of other vehicles involved in the collision. However, about 29% of those seriously injured in commercial vehicle collisions were occupants of the CMV. See the following two charts. (Transport Canada, November 2023)
- For most fatal and injury commercial collisions, no driver-related contributing factors were identified. Identified driver-related factors were distraction/inattention (8% of fatal collisions, 14% of injury collisions); driving too fast for conditions (5% and 9% respectively); fatigue (1.5% of both fatal and injury collisions); and driving under the influence (1.2% and 0.6% respectively). The incidence of fatigue is likely greatly underestimated because of a lack of objective evidence for fatigue. (Transport Canada, November 2023)
- The following table lists the national-average salary ranges (10th percentile, 25th percentile, median, 75th percentile and 90th percentile) for several kinds of truck-driving jobs, based on the required class of commercial driver’s license and the required number of years of experience. Note: bonuses are not included in these figures. (Salary Wizard Canada, Salary.com, 2025, accessed June 2025)
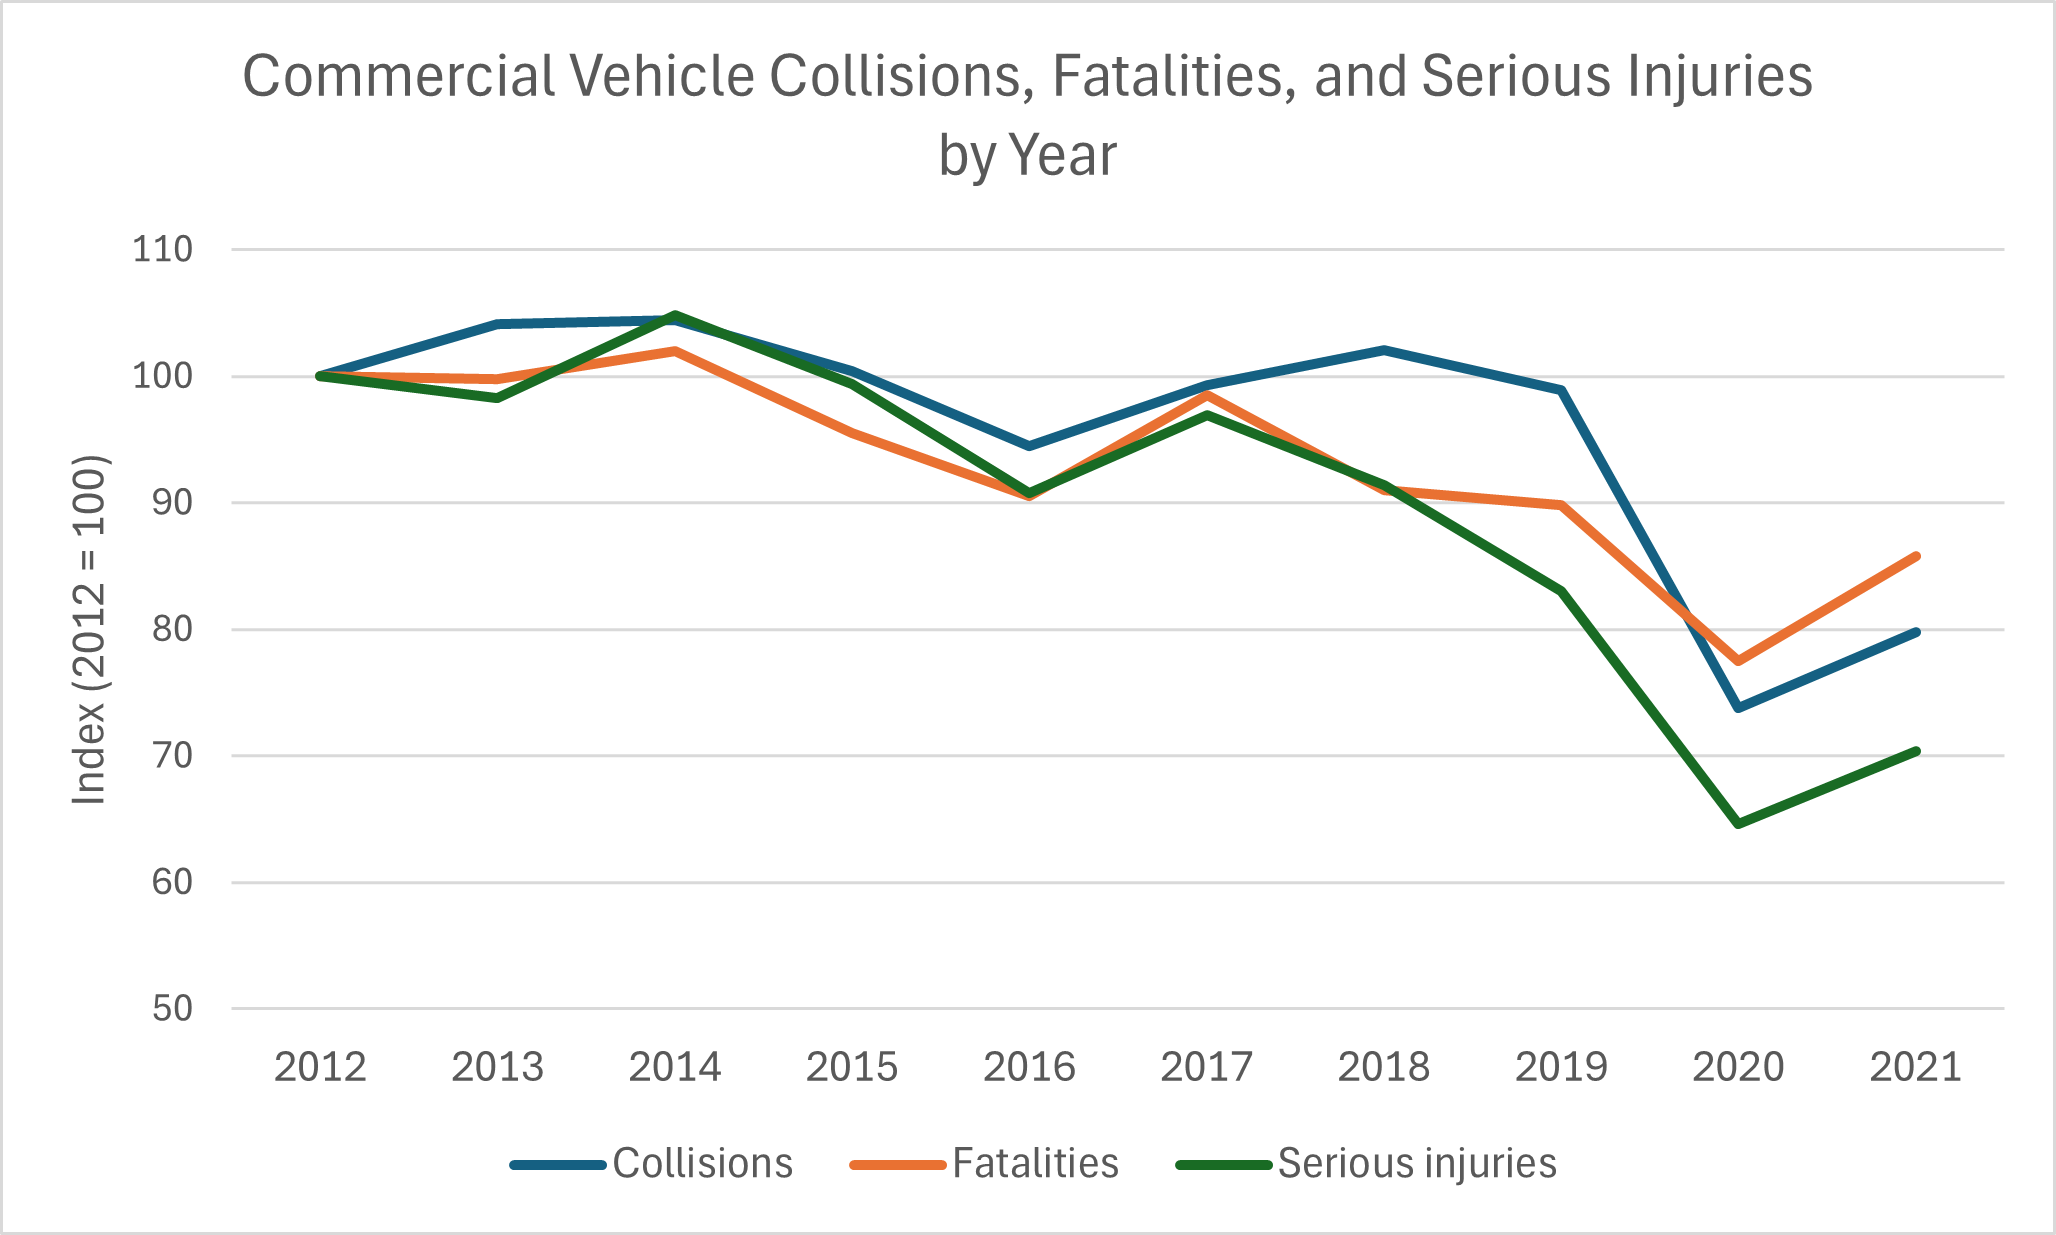
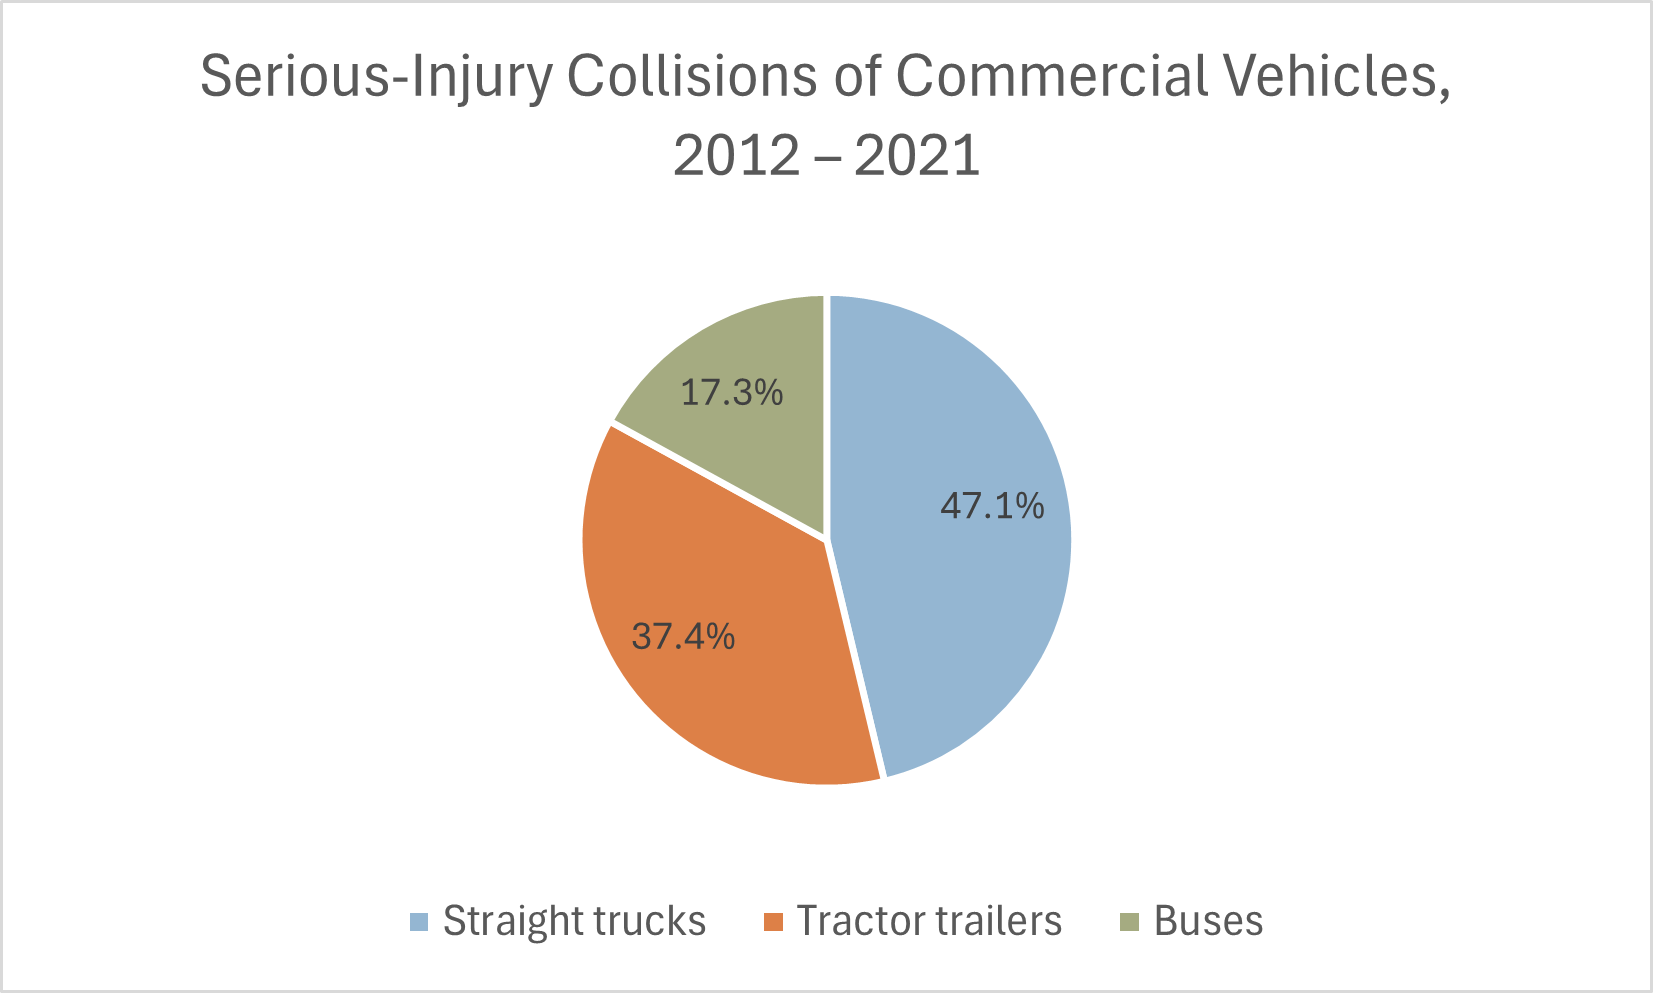
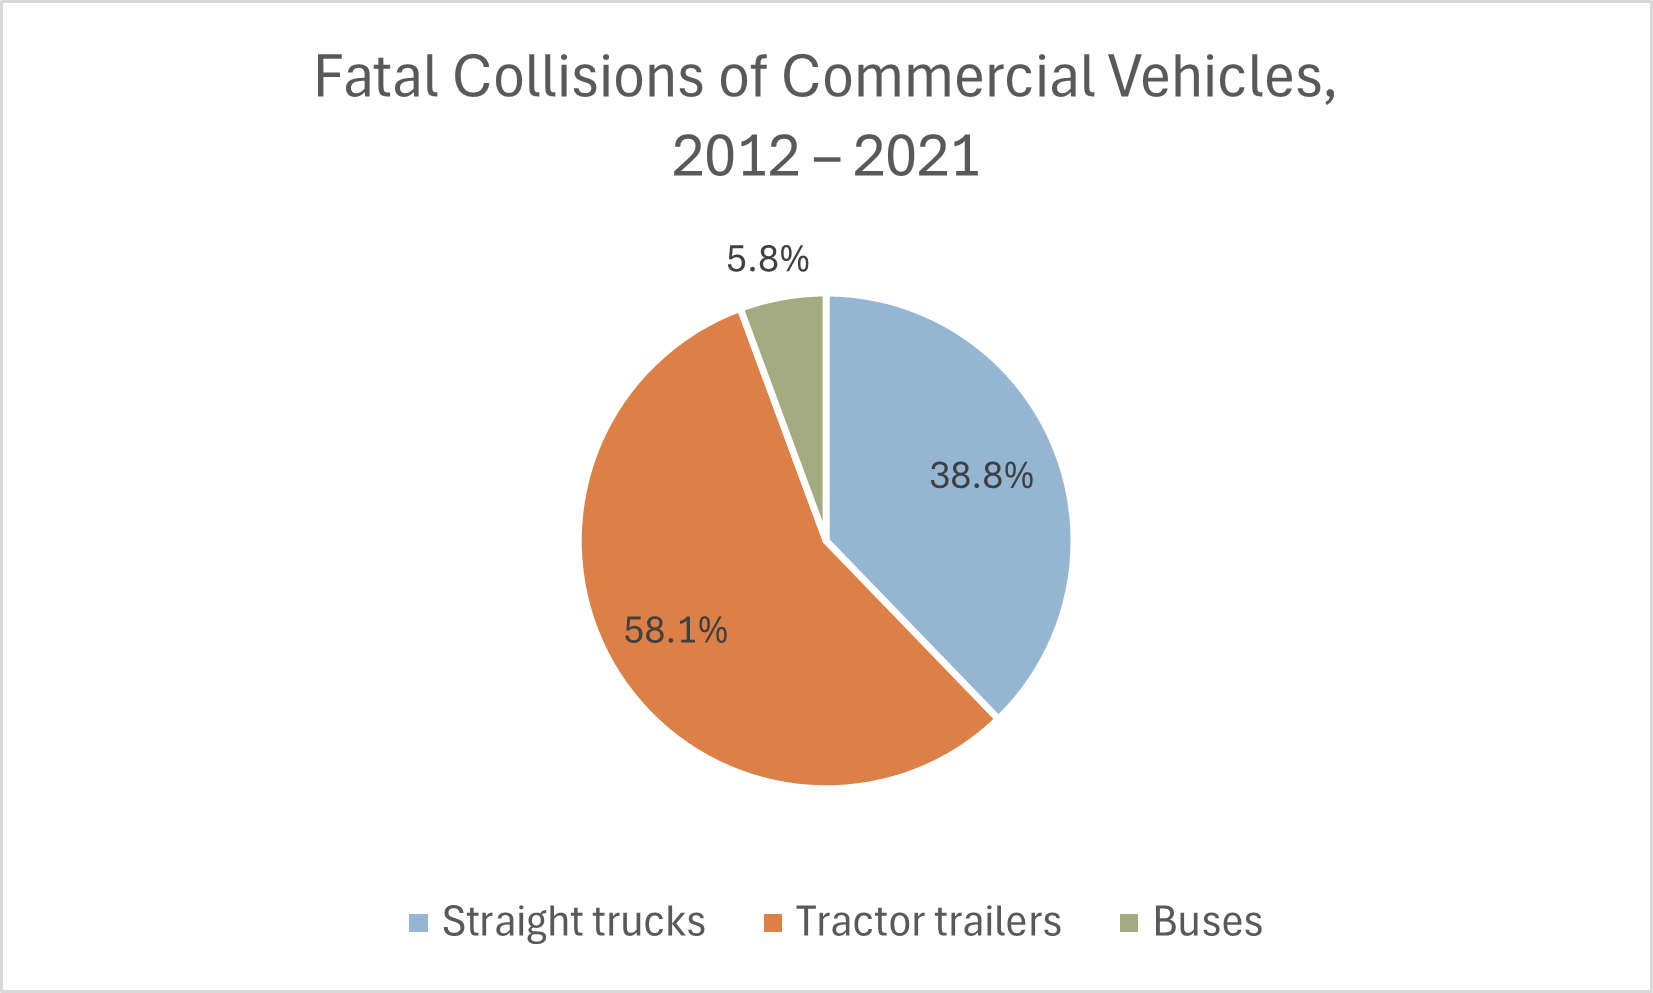
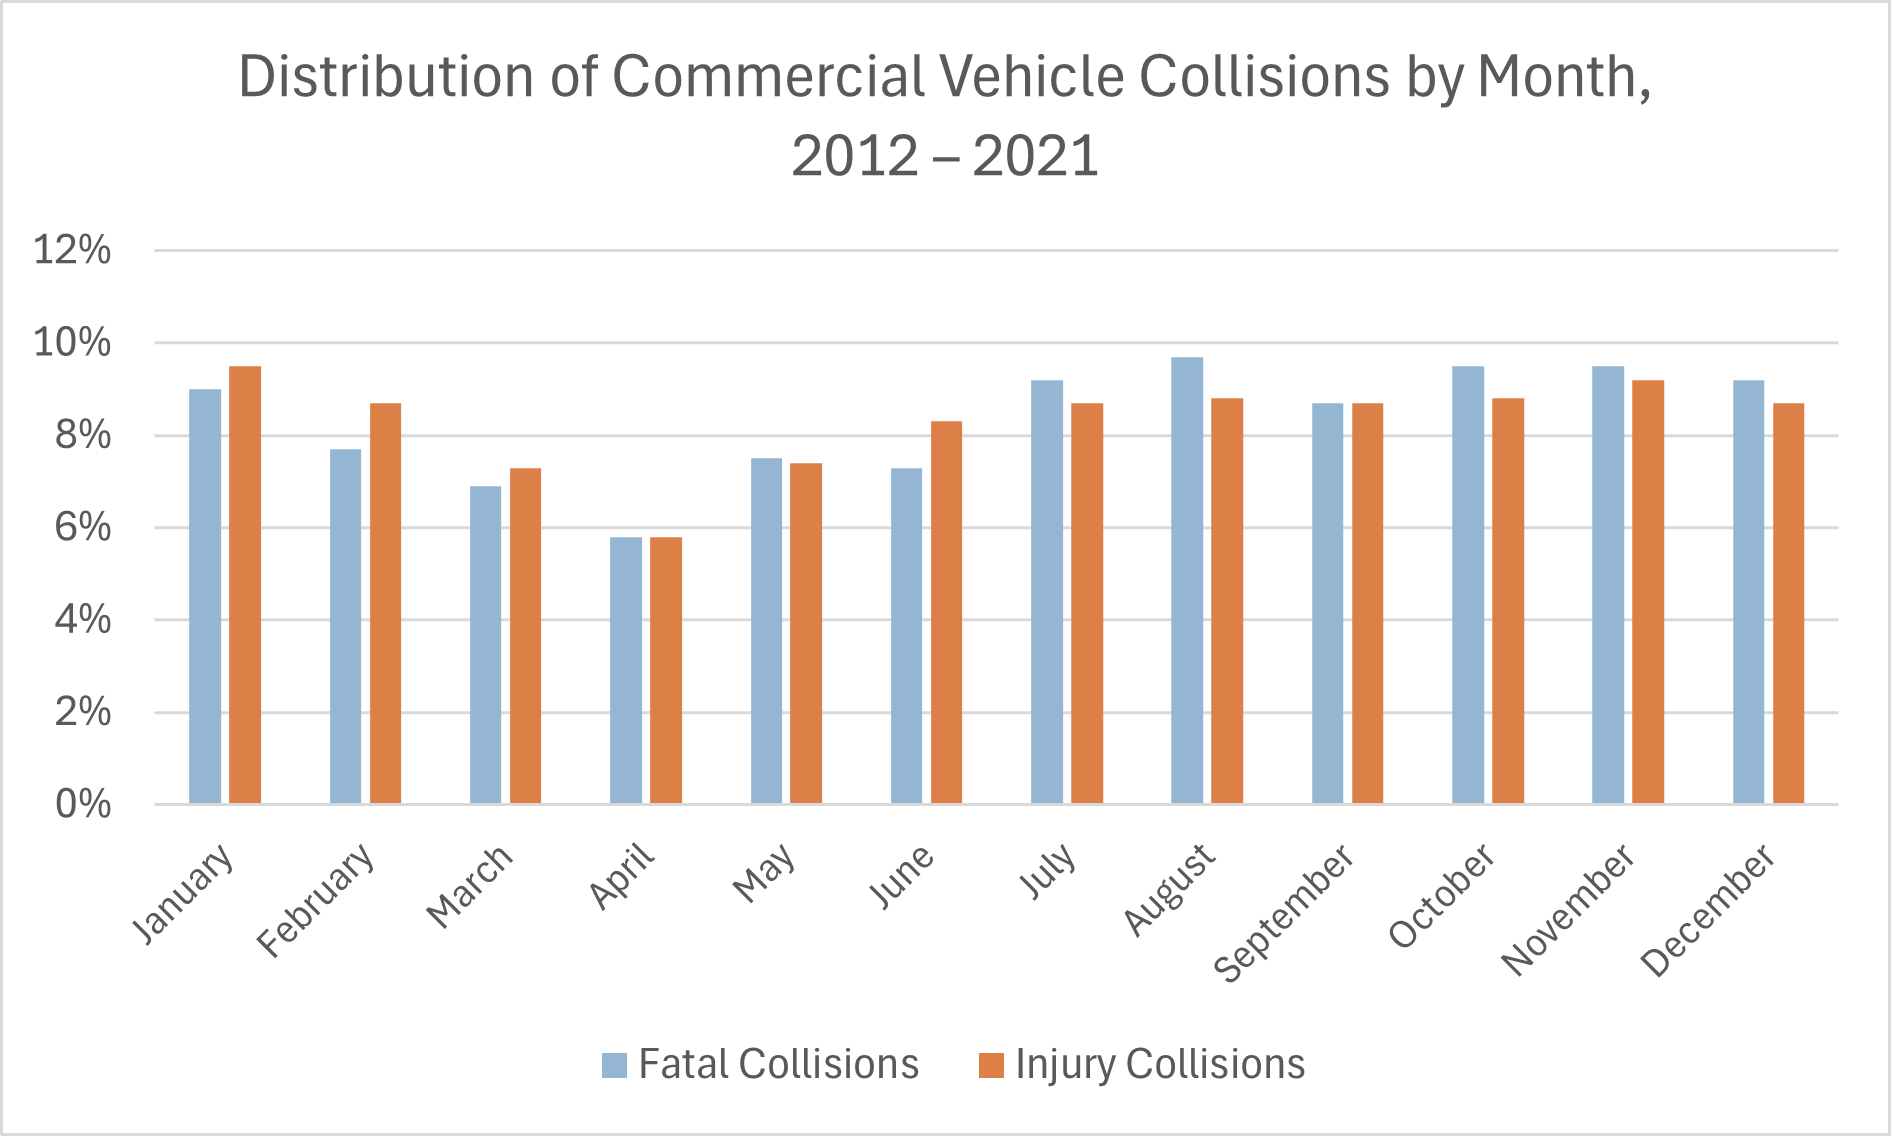
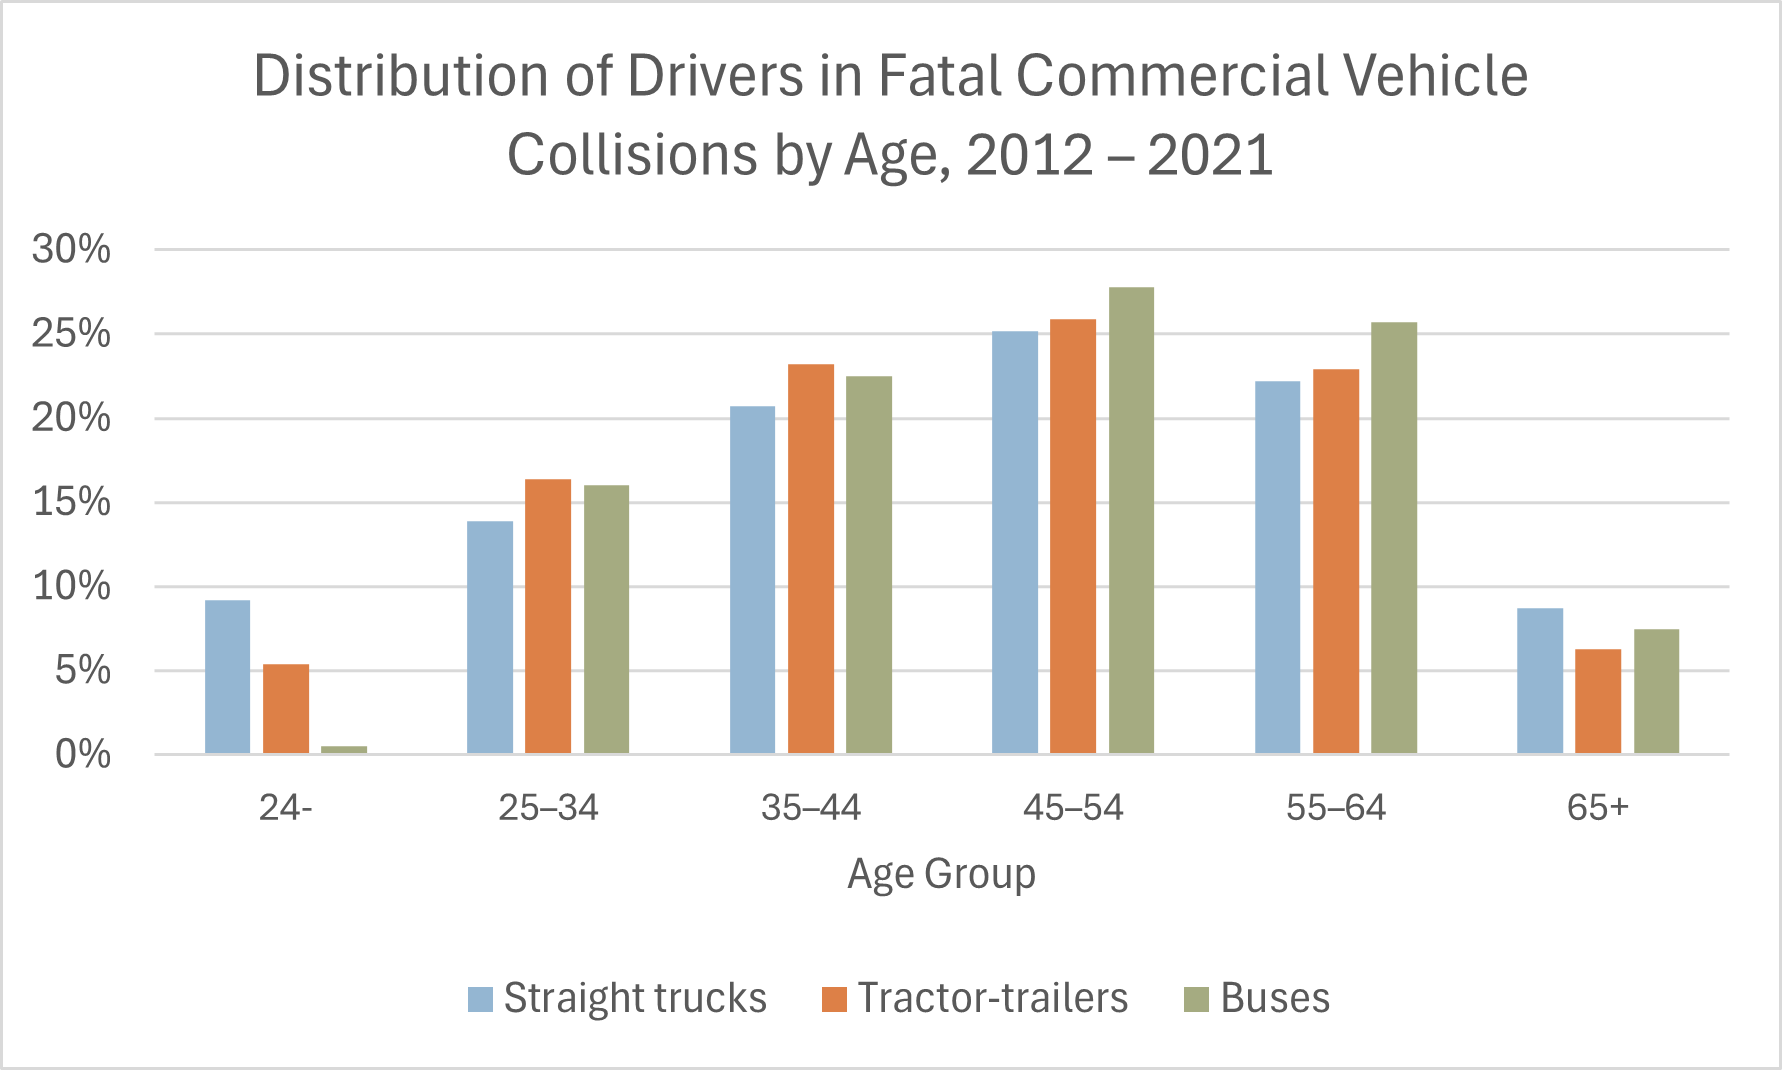
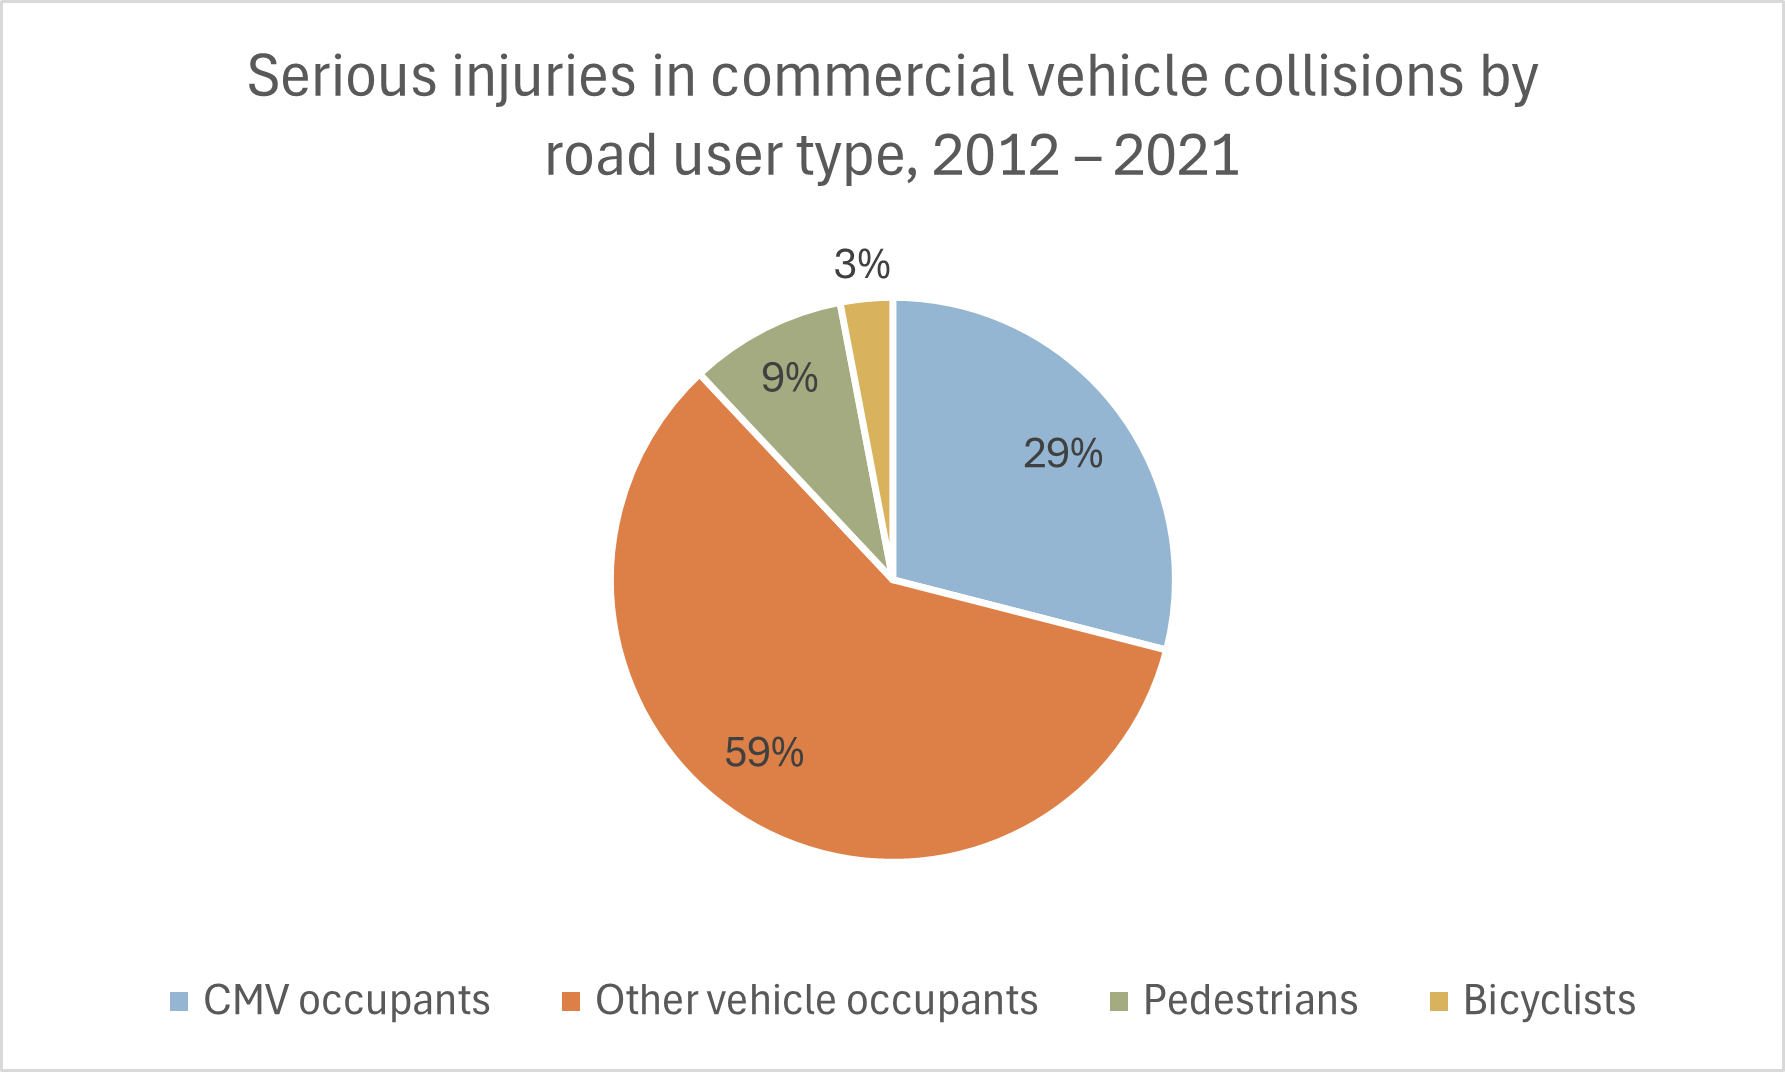
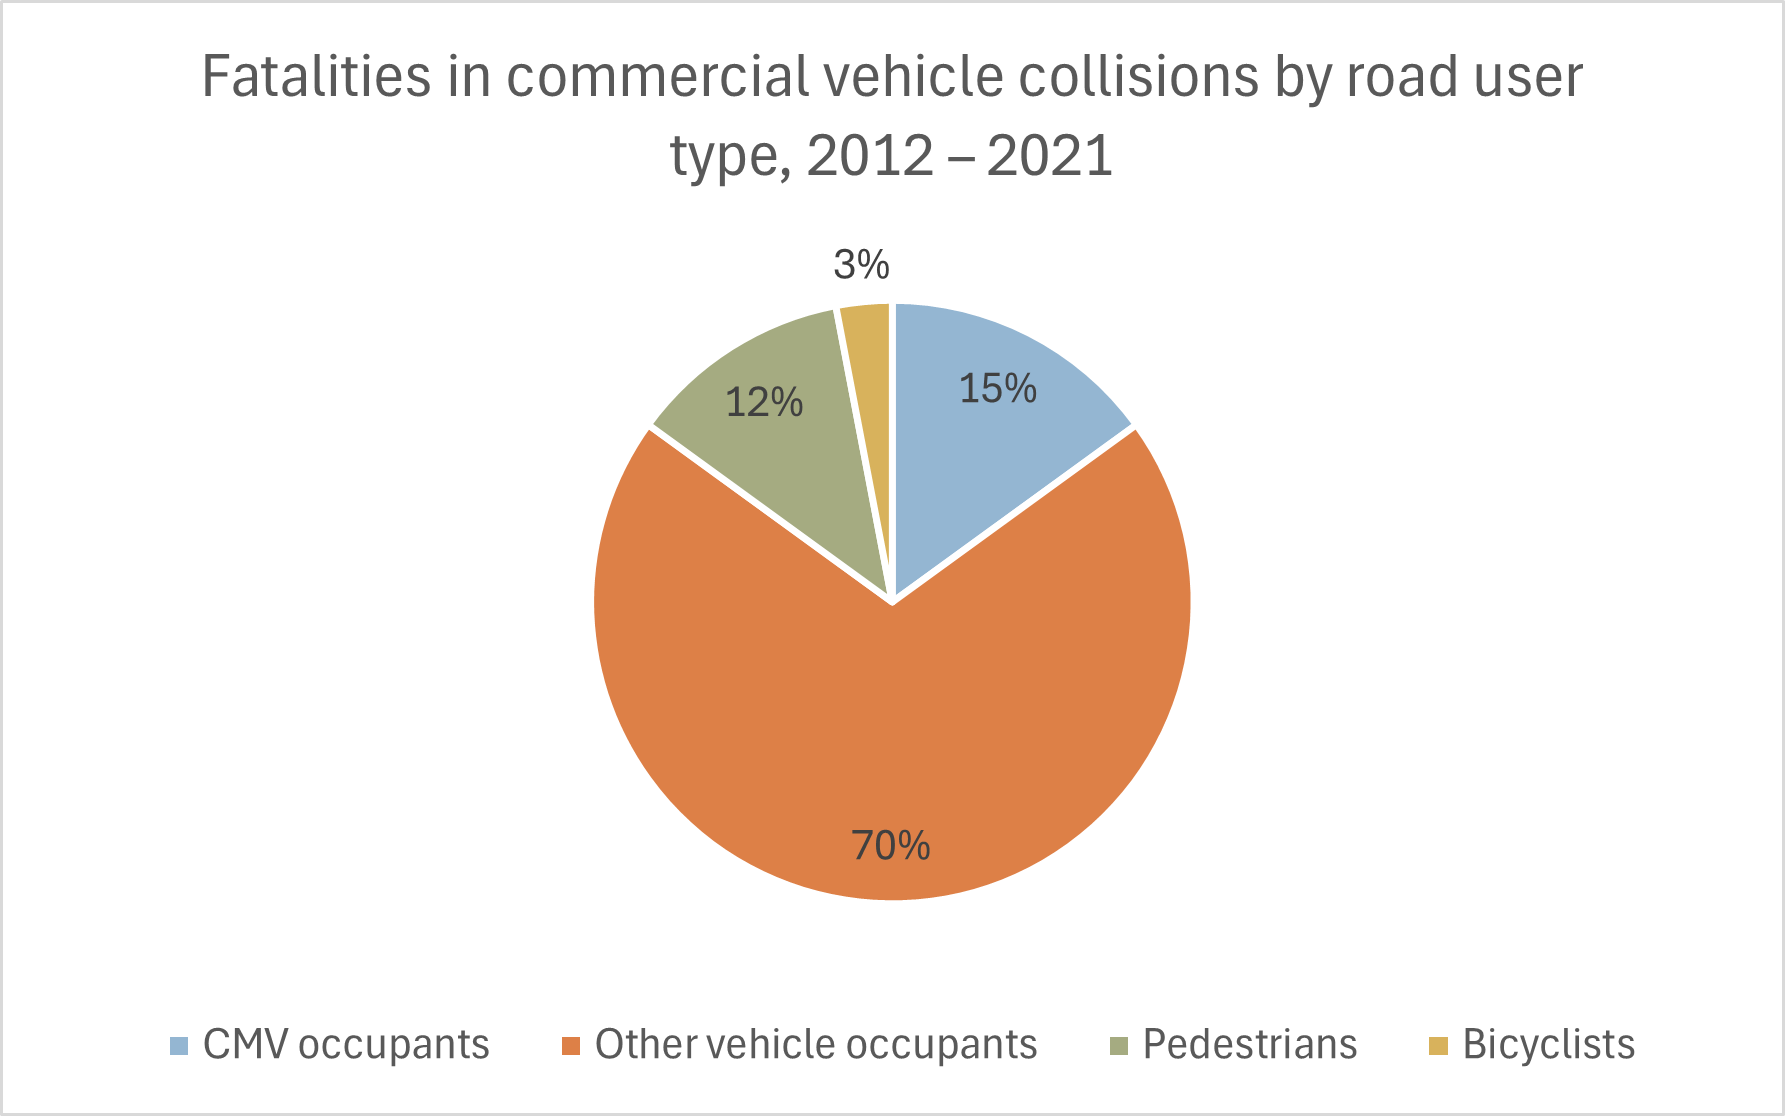
|
Job |
License Class |
Years Experience |
10th |
25th |
Median |
75th |
90th |
|
Heavy Truck Driver |
1 |
0–1 |
$41,618 |
$48,500 |
$56,060 |
$65,431 |
$73,963 |
|
Heavy Truck Driver |
1 |
1–3 |
$47,726 |
$55,371 |
$63,768 |
$72,227 |
$79,928 |
|
Heavy Truck Driver |
1 |
3–5 |
$50,246 |
$60,365 |
$71,480 |
$82,182 |
$91,925 |
|
Heavy Truck Driver |
1 |
5–7 |
$57,741 |
$66,602 |
$76,334 |
$85,693 |
$94,214 |
|
Light Truck Driver |
3 |
1–3 |
$38,692 |
$45,964 |
$53,950 |
$62,712 |
$70,690 |
|
Delivery Truck Driver |
5, possibly 3 |
1–3 |
$38,070 |
$44,916 |
$52,436 |
$60,944 |
$68,690 |
Bus Driving Statistics
- In 2023, there were 65,149 registered buses in Canada, making up 0.3% of all registered motor vehicles. (Statistics Canada, October 2024)
- In 2023, urban transit buses alone travelled a total of 1,253,708,723 kilometres, longer than the distance from the planet Earth to the planet Jupiter. (Statistics Canada, June 2025)
- In 2023, 82,265 buses were operated in Canada to generate revenue, of which 45,117 – more than half – were school buses. See the following chart. (Statistics Canada, June 2025)
- In the period 2011–2023, the number of school buses operated in Canada increased by 24.4%, and the number of urban transit buses increased by 24.6%. However, the number of motor coaches declined by 21.0%. The number of coach buses had been declining from 2014 to 2020. There followed an especially sharp additional decline in 2020–2021, probably caused by the COVID pandemic and its repercussions. (In the United States, the motor coach industry lost 82.6% of its business as some 80–95% of expected trips were either cancelled or never booked.) See the following chart. (Statistics Canada, June 2025)
- In 2018, students were about 80 times more likely to get to school safely when taking a school bus instead of travelling by car. (Transport Canada, February 2020)
- In 2020, school buses accounted for 0.3% of fatal collisions and 0.1% of injury collisions. Transit buses accounted for 0.3% of fatal collisions and 0.4% of injury collisions. Intercity buses accounted for 0.1% of fatal collisions and 0.1% of injury collisions. Buses of unspecified type accounted for 0.1% of fatal collisions and 0.1% of injury collisions. These figures were dwarfed by the fatal and injury collisions for other types of vehicles. (Transport Canada, December 2022)
- Fatalities on school buses have accounted for less than 0.1% of all traffic fatalities in Canada. Between 2009 and 2018, there was just one school bus passenger fatality on Canadian roads. (Transport Canada, February 2020)
- The bus fatality rates (all bus types) have been extremely low (especially when compared with the fatality rates for passenger cars):
- 6.9 fatalities per 100,000 licensed drivers
- 4.9 fatalities per 100,000 population
- 4.5 fatalities per billion vehicle kilometres (Transport Canada, May 2025)
- In 2023, there was a total of just nine occupant fatalities for these three types of buses combined: two school bus fatalities, three urban transit bus fatalities, and four motorcoach fatalities. These fatalities made up just 0.5% of all traffic fatalities that year. (Canada National Collision Database, accessed June 2025)
- For bus drivers in August 2024, the average base hourly wage rates were $15.58 per hour (10th percentile), $22.57 per hour (median), and $35.29 per hour (90th percentile). These three figures translated into annual salaries of $32,406, $46,947, and $73,403 respectively. (Payscale, 2025)
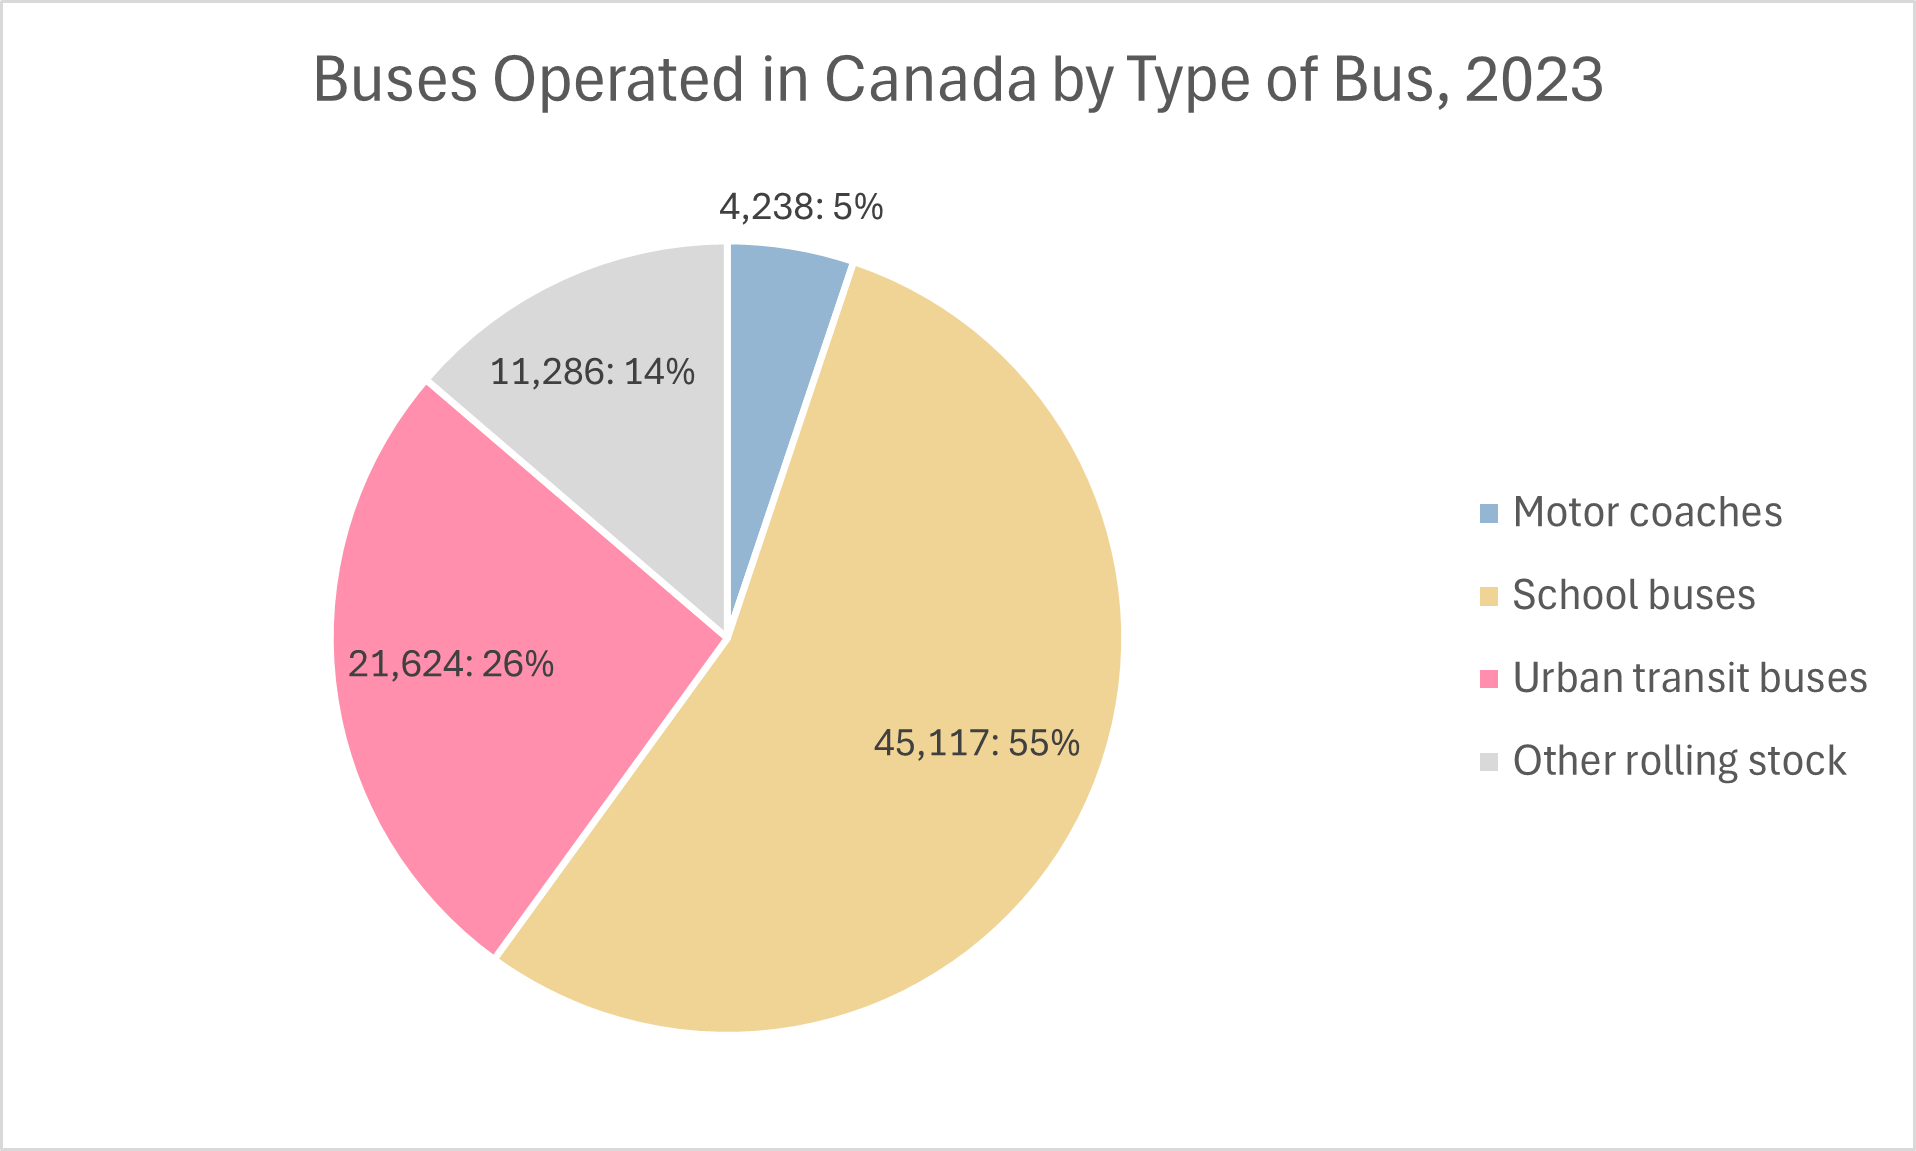
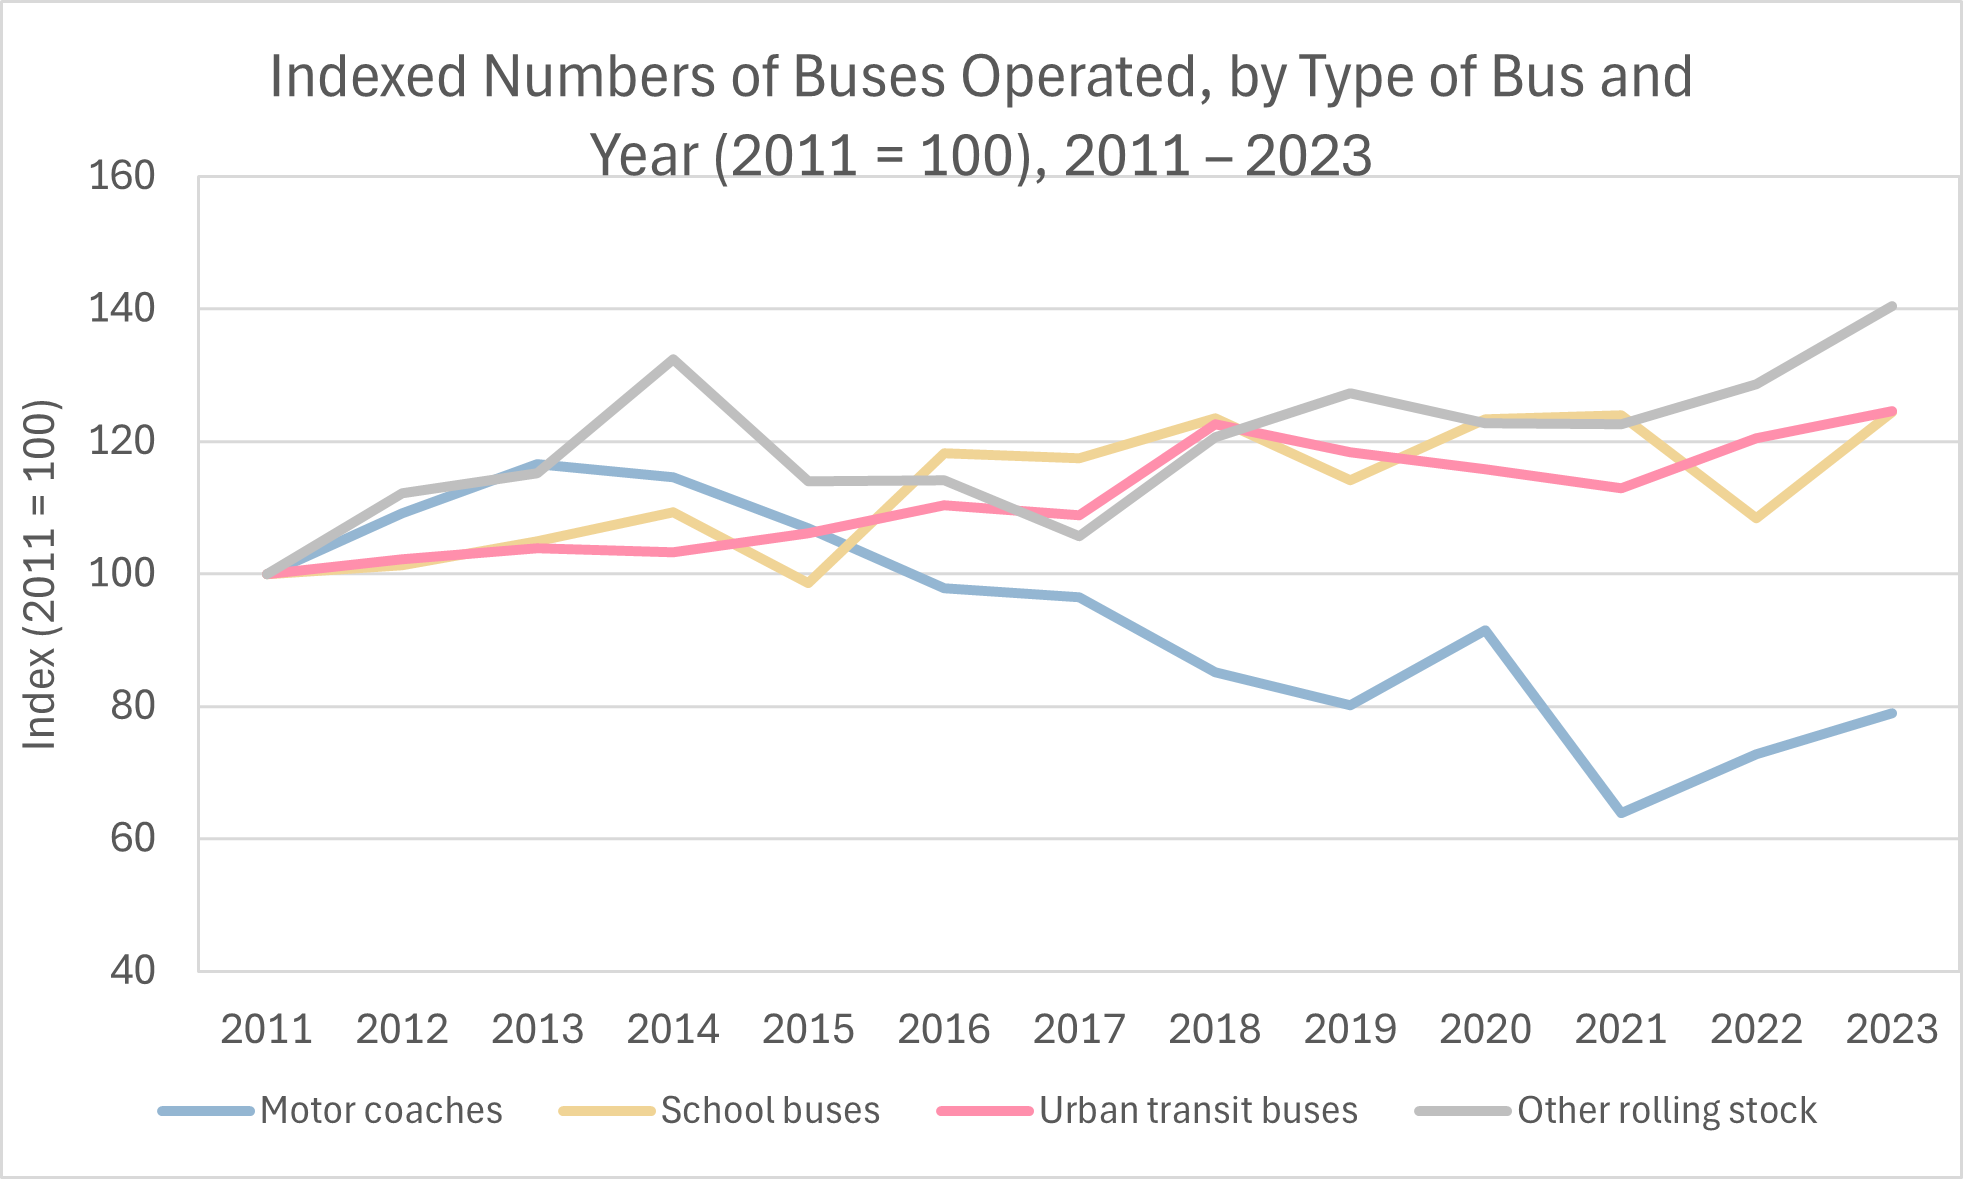
Taxi/Ridesharing/Limousine Statistics
- As of 2012, there were about 50,110 taxi drivers in Canada. Immigrants made up less than one-quarter of Canada’s population but about 50.1% of Canada’s taxi drivers. In some major cities, the percentages were even higher. Immigrants made up 82.5% of Toronto’s taxi drivers. (Unfortunately, no more recent reliable data is available.) (Citizenship and Immigration Canada, May 2012)
- According to the 2006 Census (apparently the last time such a comprehensive study of immigrant taxi drivers was done), about 44.1% of taxi drivers and 52.9% of immigrant drivers had at least some postsecondary education. 9% of taxi drivers held a bachelor’s degree; 3% of drivers held a master’s degree; and 0.5% of drivers held a doctorate or medical degree. (Citizenship and Immigration Canada, March 2012)
- The taxi and limousine industry is struggling, putting downward pressure on employment and salaries in that industry. In 2025–2030, revenue is expected to decline at an annual rate of 1.52%. Likewise, strong competition from ridesharing services (e.g., Uber) is expected to cause user penetration to decline from 14.3% in 2025 to 12.2% in 2030. (Statista, June 2025)
- For taxi drivers in December 2024, the average base hourly wage rates were $19.65 per hour (25th percentile), $24.35 per hour (median), and $25.70 per hour (75th percentile). These three figures translated into annual salaries of $40,872, $50,648, and $53,456 respectively. (Payscale, 2025)
- From 2000 to 2012, taxi drivers had a higher risk of being murdered than workers in any other occupation – even police. Taxi drivers were twice as likely as police officers to be a victim of homicide while working. (CBC News, 2012)
- In the United States, taxi drivers are 30 times more likely to be murdered on the job than workers in other professions. 94% of attacks on taxi drivers occur while the taxi driver is inside the vehicle. (Carsurance, March 2022)
- According to Uber, there were over 140,000 Uber drivers and delivery people (e.g., Uber Eats) in Canada in 2023. (Uber Canada, 2023)
- As of May 2025, a typical hourly wage of an Uber driver in Canada was $20.59, which is slightly above the minimum wage. but chance earnings could range from $15 to $31 per hour. (Dundas Life, May 2025)
- The effects of ridesharing services on the total number of fatal collisions are unclear. Various researchers have found either positive effects, negative effects, or no significant effects. For example, one study by the University of Chicago and Rice University in 2020 found a 2–3% increase in fatal collisions and fatalities associated with the introduction of ridesharing. However, most of these studies were based on the timing of entry of ridesharing services into certain communities (i.e., what happened in the community after ridesharing started?) and failed to account for the major differences in ridesharing activity among communities.
- Using proprietary data on ridesharing activity provided by Uber, a study by the US National Bureau of Economic Research in July 2021 found that ridesharing was associated with a 4% reduction in traffic fatalities and a 6.1% reduction in alcohol-related traffic fatalities. Finally, a systematic literature review in 2023 found that the introduction of ridesharing consistently led to fewer alcohol-related crashes but had no significant effect on non-alcohol-related crashes. (Kaufman, Elinore et al., July 2025)
Seat Belt and Child Restraint Statistics
- Lap-and-shoulder combination seat belts, when used properly, reduce the risk of fatal injury to front-seat passenger car occupants by 45% and the risk of moderate-to-critical injury by 50%. For light-truck occupants, seat belts reduce the risk of fatal injury by 60% and moderate-to-critical injury by 65%. (NHTSA, July 2023)
- If you are not wearing a seat belt, you are 30 times more likely to be ejected from your vehicle during a crash. (Your chances of death are much higher if you are ejected from your vehicle.) (Driver Knowledge, 2019)
- By 2023, the seat belt usage rate in Canada had risen to at least 95%. (International Transport Forum, 2024)
- We would expect that increased seatbelt use would result in fewer vehicle occupant fatalities and injuries in collisions. For relatively small percentage increases in seatbelt use, we can model this effect on fatalities with a simple linear equation:
∆F=∆U×B×E
where ∆F is the resulting decrease in fatalities, ∆U is the increase in the seatbelt usage rate, B is the original number of fatalities before seat belt use increases, and E is the effectiveness of seat belts in reducing the risk of death for a vehicle occupant. According to the US National Highway Traffic Safety Administration (NHTSA), wearing a seatbelt reduces the risk of death for a front-seat occupant by at least 45%, so E=0.45.
For example: In 2023, there were still 1,025 driver fatalities in Canada with a seatbelt usage rate of around 95%. If the seatbelt usage rate rises by five percentage points to 100%, this should cause the average number of fatalities per year to decrease by approximately
∆F=0.05×1,025×0.45≅23
- In 2023, 32.6% of the drivers who were killed in crashes and 11.1% of the drivers who were seriously injured were not wearing seat belts. These figures are greater than the corresponding figures (25.6% and 10.3%) in 2019. 32.0% of the passengers who were killed in crashes and 18.9% of the passengers who were seriously injured (i.e., who required hospitalization) were not wearing seat belts either. These figures are also greater than the corresponding figures (29.8% and 13.3%) in 2019. (Transport Canada, May 2025)
- Seat belt use among vehicle occupants varies along several dimensions. The occupants most likely to wear seatbelts are older female front-seat occupants of SUVs and vans. Here are the observed seat belt use rates in the United States in 2022, based on observational studies: (IIHS, January 2025)
- Drivers: 92%
- Right front-seat passengers: 90%
- Rear-seat passengers: 82%
- Male front-seat occupants: 89%
- Female front-seat occupants: 92%
- Front-seat occupants ages 116–24: 88%
- Front-seat occupants ages 25–69: 92%
- Front-seat occupants ages 70 and older: 94%
- Occupants of vans and SUVs: 94%
- Occupants of cars: 91%
- Occupants of pickup trucks: 87%
- Motor vehicle crashes are the leading cause of death in children aged 0–14. Among child passengers aged 0 to 14 in 2023, vehicle crashes resulted in 50 fatalities and 6,308 injuries, of which 394 were serious enough to require hospitalization. Also see the section Fatalities by Age. (Transport Canada, May 2025)
- When used correctly, child restraints reduce fatalities in passenger cars by 71% for infants (younger than one year old) and by 67% for children aged one to four years. For children who weigh at least 18 kg, booster seats provide 59% more protection in a crash than seat belts alone. (CAA, 2025)
- With 45% to 60% effectiveness, seat belts are the single most effective means of reducing the risk of death in a crash. (AAA, 2019)
- Seat belt use in motor vehicles saves an estimated 1,000 lives in Canada each year. (Halton Regional Police Service, January 2021)
- One survey found that in the United States, 91% of front-seat passengers wear seat belts, but only 74% of rear-seat passengers in personal vehicles and 57% in hired vehicles (e.g., taxis) wear seat belts. The most commonly cited reason for not wearing a seat belt in the rear seat was the belief that the rear seat is safer than the front seat. (Actually, modern front-seat safety devices have negated that safety advantage.) (IIHS, 2017)
- One study found that in modern cars with front-seat safety devices such as airbags, the risk of a restrained passenger dying in a crash was no greater in the front seat than in the rear seat. Furthermore, unrestrained rear-seat passengers were nearly eight times as likely to sustain a serious injury in a crash as restrained rear-seat passengers. (IIHS and the Children’s Hospital of Philadelphia, 2015)
- A survey of 9,615 child passengers at intersections across Canada found that 402 children (4.2%) were unrestrained by either child restraints or seat belts. 5.1% of children aged 4 to 8 were unrestrained, as were 4.4% of children aged 9 to 14. 1.6% of infants under one year of age were also unrestrained. Still other children were inappropriately restrained for their ages. Use of age-appropriate child restraints ranged from only 53.5% in Saskatchewan to 91.5% in the Yukon. (Transport Canada, 2010)
- Unfortunately, child restraints aren’t always used correctly. A recent roadside survey by the Child Passenger Association of Canada (CPSAC) found:
- 73% of child car seats were used or installed incorrectly
- 30% of children in booster seats did not meet the 18 kg minimum weight to use a booster seat
- 52% of children wearing seat belts did not fit them safely and should have been in booster seats (CPSAC, 2025)
Airbags Statistics
- In frontal crashes in the United States, frontal airbags reduce driver fatalities by 29% and fatalities of front-seat passengers ages 13 and older by 32%. The combination of an airbag and a lap and shoulder belt is estimated to reduce the risk of death in frontal crashes by 61%, compared with a 50% reduction for belts alone and a 34% reduction for airbags alone. (IIHS, February 2025)
- NHTSA estimates that in the United States from 1996 through 2012, 2,252 lives were saved by side airbags; in 2019 alone, 4,330 lives were saved by frontal airbags; and up through 2019, 70,059 lives were saved by frontal airbags. (IIHS, February 2025)
- Unlike the United States, Canada does not publish figures on the percentage risk reduction achieved with airbags. However, Transport Canada (July 2004) estimated that in 1990–2000, airbags saved about 300 lives in Canada. Based on the sizes of Canada’s population and motor vehicle fleet relative to their American counterparts, we can estimate that airbags save about 300–350 lives per year in Canada.
- In driver's-side crashes in the United States, side airbags with head protection reduce a car driver's risk of death by 37% and an SUV driver's risk of death by 52%. (IIHS, February 2025)
- In nearside crashes, curtain airbags together with torso airbags reduce the risk of death to an occupant by 31%, and combination head/torso airbags reduce the risk of death by 25%. (A “nearside crash” is a crash on the same side of the vehicle as the occupant.) (IIHS, February 2025)
- In 1990–2008, early frontal airbags, which deployed with much force, caused more than 290 deaths in low-speed crashes. Severe injury was more likely with children and unrestrained adult passengers in the front passenger seat. Newer designs of airbags have largely eliminated this problem. (IIHS, February 2025)
- Studies indicate that there may be a correlation between height, weight, and driver injuries from airbags. Shorter (under 160 cm or 5’3”) and lighter (under 55 kg or 121 lb) drivers who sit closer to the steering wheel suffer more injuries from airbags. (The Royal Society for the Prevention of Accidents, 2017)
- In general, European airbags hold 35 litres of gas propellant and fully inflate within 25 milliseconds, which means that they expand at anything up to 160 mph. American airbags, usually holding 60 litres of gas, must inflate even faster. (The Royal Society for the Prevention of Accidents, 2017)
- The Takata airbag recall was the largest recall in US automotive history up to that time, involving the recall of over 67 million vehicles in the United States. Long-term exposure to high heat and humidity could cause these airbags to explode when deployed. This problem resulted in 23 confirmed US deaths and over 250 reported US injuries.
- Over 5 million Takata airbags were recalled in Canada. Fortunately, however, neither Transport Canada nor auto manufacturers received reports of serious incidents in Canada caused by defective Takata airbags. (Alexander Brangman IIHS, February 2025)
Red Light Safety Statistics
- In 2021, 42.8% of traffic collisions, 44.2% of traffic injuries, and 24.6% of traffic fatalities occurred at intersections of at least two public roadways. (Canada National Collision Database, accessed July 2025)
- Studies of busy US intersections without red-light cameras have found motorists running red lights at an average rate of about once every 19 or 20 minutes per intersection. See the section Aggressive Driving Statistics for details.
- In a survey of 1,027 Canadian drivers in 2021, 9% of the drivers admitted to running a red light. (Finder.com, September 2021)
- A study comparing large US cities with red-light cameras to cities without cameras found that red-light cameras had reduced the rate of fatal collisions caused by red-light running by 21%. They had also reduced the rate of fatal collisions at signalized intersections generally by 14%. (IIHS, July 2025)
- A study conducted in Philadelphia, Pennsylvania in 2007–2008 found that lengthening the traffic lights’ yellow change interval (the amount of time that the traffic signal is yellow before it changes to red) reduced the number of red-light running violations by 36%. Installing red-light cameras and enforcing violations reduced the number of red-light running violations by 96% beyond the 36% reduction attained by adjusting the yellow change intervals. (IIHS, June 2024)
Advanced Driver Assistance Statistics
- In the United States, there is real-world data (based on insurance claims and police reports of crashes) on the safety benefits of the following crash avoidance technologies:
- Automatic Emergency Braking (AEB): Detects an imminent forward collision with the vehicle in front and automatically applies the brakes.
- AEB with Pedestrian Detection: Detects an imminent forward collision with a pedestrian ahead and automatically applies the brakes.
- Lane Departure Warning: Alerts the driver if the vehicle starts to drift out of its lane without the driver activating a turn signal.
- Blind Spot Detection: Scans the areas around the vehicle to warn the driver of other vehicles in the vehicle’s blind spots.
- Rear Automatic Braking: When the vehicle is in reverse, detects an imminent rearward collision with an object in the rear and automatically applies the brakes.
- Rearview Cameras: Provide a live video feed of the area behind the vehicle to assist in reversing safely.
- Rear Cross-Traffic Alert: When backing out of a parking space or driveway, warns of traffic approaching from either side.
See the following table. For each technology, the percentage reduction in crashes or insurance claims (relative to vehicles lacking the technology) is listed. The percentage reductions shown are for passenger vehicles except where otherwise noted. Percentage reductions greater than 40% are highlighted. (IIHS, May 2025)
|
Technology |
Real-World Benefits |
|
Automatic Emergency Braking (AEB) |
✅ 50% fewer front-to-rear crashes ✅ 56% fewer front-to-rear crashes with injuries • 14% reduction in damage claims to other vehicles • 24% reduction in injury claims to other vehicle occupants ✅ 41% fewer large-truck front-to-rear crashes |
|
AEB with Pedestrian Detection |
• 27% fewer pedestrian crashes • 30% fewer pedestrian injury crashes |
|
Lane Departure Warning |
• 11% fewer single-vehicle, sideswipe, and head-on crashes • 21% fewer injury crashes of the same types |
|
Blind Spot Detection |
• 14% fewer lane-change crashes • 23% fewer lane-change injury crashes • 7% fewer damage claims to other vehicles • 8% fewer injury claims to other vehicle occupants |
|
Rear Automatic Braking |
✅ 78% fewer backing crashes (with camera and sensors) • 9% fewer claims for damage to insured vehicle • 29% fewer claims for damage to other vehicles |
|
Rearview Cameras |
• 17% fewer backing crashes |
|
Rear Cross-Traffic Alert |
• 22% fewer backing crashes |
- These driver-assistance features can work only if the driver ensures they are activated and is willing to heed the warnings they provide. However, in a survey of 1,529 drivers aged 18 and older in Canada, 52% of respondents said they rarely or never rely on driver-assistance features, 42% said that the warnings provided by those features served to distract them, and 56% said they had disabled at least one of the features. The two most frequently cited reasons for disabling driver-assistance features were annoyance (63%) and lack of trust in them (14%).
Vehicle Automation Statistics
- It is forecast that in 2025, about 63% of new cars sold worldwide will have level 2 automation or better. (Level 2 automation employs an automated acceleration and braking system, such as Adaptive Cruise Control, working in conjunction with an automated steering system, such as Lane Keeping Assist. Cars with only Level 1 automation provide either automated acceleration and braking or automated steering at a given time, but not both at the same time.) About 12% of cars sold in 2025 will feature Level 2 Advanced (also known as “Level 2+”) automation. There is no official definition of Level 2 Advanced automation, but it is expected to provide more advanced versions of the capabilities of Level 2 automation. A vehicle equipped with Level 2 Advanced automation may be able to detect pedestrians automatically, for example. About 4% of cars sold in 2025 will be equipped with pilot versions of Level 3 automation. A car equipped with Level 3 automation may be able to change lanes on its own or navigate its way through a complex highway interchange. However, human driver oversight will still be required. By 2030, some cars equipped with Level 4 automation will be available for sale. These cars will be capable of driving entirely on their own, although the driver will still be able to control the vehicle manually if desired. See the following chart. (Counterpoint, November 2022; Statista, March 2023)
- In April 2021, a survey of automobile owners in Canada found that 32% of respondents were excited about the possibility of owning an autonomous vehicle, but 29% were concerned about it. 46% of respondents preferred to remain the driver of the vehicle. 34% of respondents chose Tesla as their most trusted brand in autonomous vehicles. When shopping for an autonomous car in the future, 47% of respondents would choose a Tesla, 31% would choose a BMW, 26% would choose a Honda, and another 26% would choose a Toyota. However, 55% of respondents wanted these brands to be responsible for any accidents. The specific feature most desired by respondents (37%) was autonomous parking. 53% of respondents would like the car to be able to drive them home safety if they were unable to do so (presumably only if they could trust the car to do it safely). Finally, only 14% of respondents were comfortable with the prospect of sharing the road with autonomous delivery trucks or fleets. (CarGurus, June 2021)
- Currently, neither Statistics Canada nor Transport Canada reports on sales of new vehicles equipped with Level 2 automation. (Level 2 automation employs an automated acceleration and braking system, such as Adaptive Cruise Control, working in conjunction with an automated but relatively limited steering system, such as Lane Centering Assistance.)
- We can get a rough lower bound on new Level 2 vehicle sales in Canada by comparison with the known global sales figures. In 2024, for example, a total of 93.5 million new vehicles (both with and without Level 2 automation) were sold worldwide, of which Canada accounted for 1.86 million (approximately 1.99% of the worldwide total). Worldwide, 18.43 million of the new vehicles sold were equipped with Level 2 automation. Suppose that Canada’s Level 2 adoption rate mirrored the worldwide adoption rate. This would mean that 1.99% of 18.43 million, or 367,000 new vehicles sold in Canada in 2024, had Level 2 automation – 18.8% of all new vehicles sold in Canada.
- Currently, no province or territory has a regulatory framework that allows the operation of vehicles equipped with Level 3 automation on public roads. (Level 3 vehicles can handle the entire driving task, including acceleration, steering, and braking, but only in certain situations, such as highway driving in good weather). For this reason, sales of Level 3 vehicles are rare.
- As seen in the section Advanced Driver Assistance Statistics, several advanced driver assistance features, especially automatic braking, have shown proven significant safety benefits in the form of fewer crashes and probably reduced insurance costs. However, recent studies have failed to find convincing evidence of similar safety benefits of Level 2 and higher vehicle automation, beyond those benefits provided by the driver assistance features the automation system comes with. The following table summarizes the observed reductions in insurance claims from ProPILOT Assist (Nissan’s automation system) and some driver-assistance features in the 2017–2019 Nissan Rogue SUV. Large, statistically significant reductions in the frequency of insurance claims were associated with certain driver-assistance features, especially rear automatic braking. (In this table, the most significant reductions are shaded in green.) On the other hand, any additional insurance claim reductions specifically associated with ProPILOT Assist were not statistically significant. (IIHS, July 2024)
- A 2020 study estimated that if alcohol detection technology is added to all new vehicles and restricts the driver’s blood alcohol concentration (BAC) to below 0.08%, over 9,000 traffic fatalities could be prevented each year in the United States. (0.08% is the legal threshold for intoxication.) If the systems prevent driving with any level of BAC above zero, nearly 12,000 fatalities could be prevented each year in the United States. An alcohol detection device measures the driver’s BAC and prevents the vehicle from starting if the driver's BAC is at or above some preset limit. By adjusting for the relative numbers of fatalities in 2020 (38,824 in America vs. 1,711 in Canada), we can estimate that this technology could save 400–500 lives in Canada each year. (IIHS, January 2021)
- Europe has found that motorcycle antilock braking systems (ABS) significantly reduce the risk of crashes involving injury to the rider. The effectiveness of motorcycle ABS in reducing injury crashes ranged from 24% (95% confidence interval [CI], 12–36) in Italy to 29% (95% CI, 20–38) in Spain, and 34% (95% CI, 16–52) in Sweden. The reductions in severe and fatal crashes were even greater, at 34% (95% CI, 24–44) in Spain and 42% (95% CI, 23–61) in Sweden. (Swedish Transport Administration (STA), 2014)
- A study of motorcycle crashes in the United States from 2003 to 2019 found that motorcycle anti-lock brakes (ABS) reduced the rate of fatal crashes by 22% compared with motorcycles without ABS. (IIHS, March 2022)
- ABS was a standard feature on 64% of motorcycles in the 2023 model year, and an optional feature on another 18%. (IIHS, December 2024)
- In 2022, among motorcycle riders (drivers, not passengers) killed in crashes in the United States, 62% were wearing helmets, 34% were not, and the rest were unknown. Among motorcycle passengers who died, 42% were helmeted, 52% were not, and the rest were unknown. (IIHS, December 2024)
- In motorcycle crashes in the United States in 2016, wearing a helmet reduced the likelihood of death by 37% for the operator and 41% for the passenger. (NHTSA, 2018)
- Australia has found that wearing protective clothing significantly reduces the risk of injury to the rider in a motorcycle crash. Motorcyclists were significantly less likely to be admitted to the hospital if they crashed wearing motorcycle jackets (relative risk = 0.79, 95% confidence interval: 0.69-0.91), pants (RR = 0.49, 95% CI: 0.25-0.94), or gloves (RR = 0.41, 95% CI: 0.26-0.66). When garments included fitted body armor, there was a significantly reduced risk of injury to the upper body (RR =0.77, 95% CI: 0.66-0.89), hands and wrists (RR = 0.55, 95% CI: 0.38-0.81), legs (RR = 0.60, 95% CI: 0.40-0.90), feet and ankles (RR = 0.54, 95% CI: 0.35-0.83). Non-motorcycle boots were also associated with a reduced risk of injury compared to shoes or joggers (RR = 0.46, 95% CI: 0.28-0.75). (University of Sydney Australia et al., 2011)
- Australia has found that wearing protective clothing significantly reduces the risk of injury to the rider in a motorcycle crash. Motorcyclists were significantly less likely to be admitted to the hospital if they crashed wearing motorcycle jackets (relative risk = 0.79, 95% confidence interval: 0.69–0.91), pants (RR = 0.49, 95% CI: 0.25–0.94), or gloves (RR = 0.41, 95% CI: 0.26–0.66). When garments included fitted body armor, there was a significantly reduced risk of injury to the upper body (RR = 0.77, 95% CI: 0.66–0.89), hands and wrists (RR = 0.55, 95% CI: 0.38–0.81), legs (RR = 0.60, 95% CI: 0.40–0.90), feet and ankles (RR = 0.54, 95% CI: 0.35–0.83). Non-motorcycle boots were also associated with a reduced risk of injury compared to shoes or joggers (RR = 0.46, 95% CI: 0.28–0.75). (University of Sydney Australia et al., 2011)
- As of February 2024, the laws in every Canadian province and territory require both motorcycle operators and motorcycle passengers to wear helmets when riding a motorcycle. However, Alberta, British Columbia, and Manitoba make an exception for someone who is a practicing member of the Sikh faith and wears a turban.
- In 2022, 49% of female bicyclists and 43% of male cyclists wore helmets regularly when riding in Canada. (Claim Accident Services, October 2022)
- In 2022, 34% of male cyclist fatalities and 21% of female cyclist fatalities were not wearing a helmet at the time of the collision. (Claim Accident Services, October 2022)
- Wearing a helmet can reduce a bicyclist’s risk of head injury by an estimated 50% and the bicyclist’s risk of head, face, or neck injury by an estimated 33%. (IIHS, August 2024)
- A 2018 meta-analysis in Europe found that the use of bicycle helmets reduced head injuries in crashes by 48%, serious head injuries by 60%, traumatic brain injuries by 53%, face injuries by 23%, and the total number of killed or seriously injured bicyclists by 34%. (Institute of Transport Economics, Norway, 2018)
- As of May 2022, British Columbia, New Brunswick, Newfoundland and Labrador, Nova Scotia, and Prince Edward Island require bicyclists of all ages to wear helmets. Alberta, Manitoba, and Ontario require cyclists under 18 years of age to wear helmets. Northwest Territories, Nunavut, Quebec, Saskatchewan, and the Yukon have no helmet requirement, although some individual municipalities there have imposed their own helmet requirements. (Parachute, May 2022)
- A study conducted from August 2014 to May 2015 in several US and Canadian cities found that Leading Pedestrian Interval (LPI) signals at intersections could reduce the incidence of collisions with pedestrians by a statistically significant 13%. LPI gives pedestrians an advanced walk signal so they can start to cross the street before vehicles get a green light to proceed.
- A study of about 1,000 roadway sites (mostly urban intersections) in 14 US cities found that the following methods reduced the estimated frequency of pedestrian crashes by the following factors:
- In this table, the Estimated Factor is the fraction of pedestrian crashes that still occur after the approach is implemented. For example, implementing pedestrian refuge islands results in an estimated (68.5±18.3)% as many pedestrian crashes as before, an estimated likely reduction of 31.5%. The large standard error for RRFBs was largely due to the relatively small sample size, so the estimated 47.4% reduction in pedestrian crashes from RRFBs is less certain than the reductions from these other methods. (Charlie Zegeer et al., January 2017)
- A 2020 study found that pedestrian hybrid beacons (also known as High intensity Activated crossWalk or HAWK beacons) at midblock crossings and uncontrolled intersections can reduce collisions with pedestrians by 55%. (Texas A & M Transportation Institute, 2021)
- In the United States in 2015, electronic stability control (ESC) saved an estimated 857 lives in passenger cars with ESC as standard equipment, and an estimated 1,091 lives in vans and light trucks with ESC standard. From 2011 (when ESC was first required on all new cars) to 2015, ESC was estimated to have saved more than 7,000 lives: 2,860 in passenger cars and 4,164 in vans and light trucks. (NHTSA, March 2017)
- Is the positive US experience with ESC applicable to Canada, where driving conditions may be different, particularly during Canadian winters? A study of real-world crash data found that ESC is indeed effective on Canadian roads covered with ice, snow and slush. It was found to be 51.1% effective for ESC-sensitive crashes generally under such conditions and 71.1% effective for ESC-sensitive injury crashes specifically. (Chouinard and Lécuyer, October 2010)
- A 2017 study of crashes in 22 states from 2010 through 2014 found forward collision warning (FCW) alone, low-speed automatic emergency braking (AEB), and FCW combined with AEB produced significant percentage reductions in the rates of rear-end crashes and their consequences. See the following chart. (Cicchino, Jessica, February 2017)
- A study found that for vehicles so equipped, automatic emergency braking (AEB) reduced the frequency of property damage liability (PDL) claims by 14.0%, collision claim frequency by 3.0%, bodily injury (BI) liability claims by between 3.3% and 30.7% (depending on the make and model of the vehicle), medical payment (MedPay) claims by 4.2%, and personal injury protection (PIP) claims by 4.0%. (IIHS, April 2023)
- A study found that for vehicles so equipped, lane departure warning (LDW) reduced the frequency of property damage liability (PDL) claims by an insignificant 0.2%, collision claim frequency by an insignificant 0.3%, medical payment (MedPay) claims by an insignificant 0.8%%, and personal injury protection (PIP) claims by 5.2%. The frequency of bodily injury (BI) liability claims actually increased by 6.2%. (IIHS, April 2023)
- IIHS and HLDI have found that FCW plus automatic emergency braking (AEB) reduced rear-end car crashes by 50%, rear-end car crashes with injuries by 56%, and large truck rear-end crashes by 41%. (IIHS, 2020)
- IIHS and HLDI have found that lane departure warning systems (LDWS) reduced single-vehicle, sideswipe, and head-on car crashes by 11%; and reduced such crashes with injuries by 21%. (IIHS, 2020)
- IIHS and HLDI have found that blind spot detection systems reduced lane-change car crashes by 14% and reduced lane-change car crashes with injuries by 23%. (IIHS, 2020)
- IIHS and HLDI have found that rear automatic braking reduced car crashes during backing by 78%. (IIHS, 2020)
- Analysis indicates that equipping large trucks with electronic stability control (ESC) may prevent or lessen the severity of up to 31,000 large truck crashes in the United States each year. ESC on large truck tractors and large buses may prevent 40–56% of untripped (no collision) rollovers and 14% of crashes caused by the driver losing control of the vehicle. (IIHS, August 2024)
- A study of Class 8 (GVWR over 33,000 pounds) heavy trucks on controlled-access highways in 2017–2019 found that forward collision warning (FCW) reduced reportable crashes per vehicle miles travelled (VMT) by 22% and rear-end crashes per VMT by 44%. AEB reduced crashes per VMT by 12% and rear-end crashes per VMT by 41%. All these figures were statistically significant. (Teoh, Eric, March 2021)
- Equipping large trucks with collision avoidance (blind spot detection, forward collision warning/mitigation, and lane departure warning) as well as electronic stability control (ESC) could reduce crashes by 28%. As many as 835 fatal truck crashes and about 12,000 injury crashes could be prevented. (IIHS, August 2024)
- A study conducted in Alabama in 2021 found that the placement of a truck-mounted electronic flashing variable message (VMS) sign at the roadside made it 95% more likely that drivers in the lane next to the roadside would move over one lane, in accordance with Alabama’s Move Over law. (AAA Foundation for Traffic Safety, January 2023)
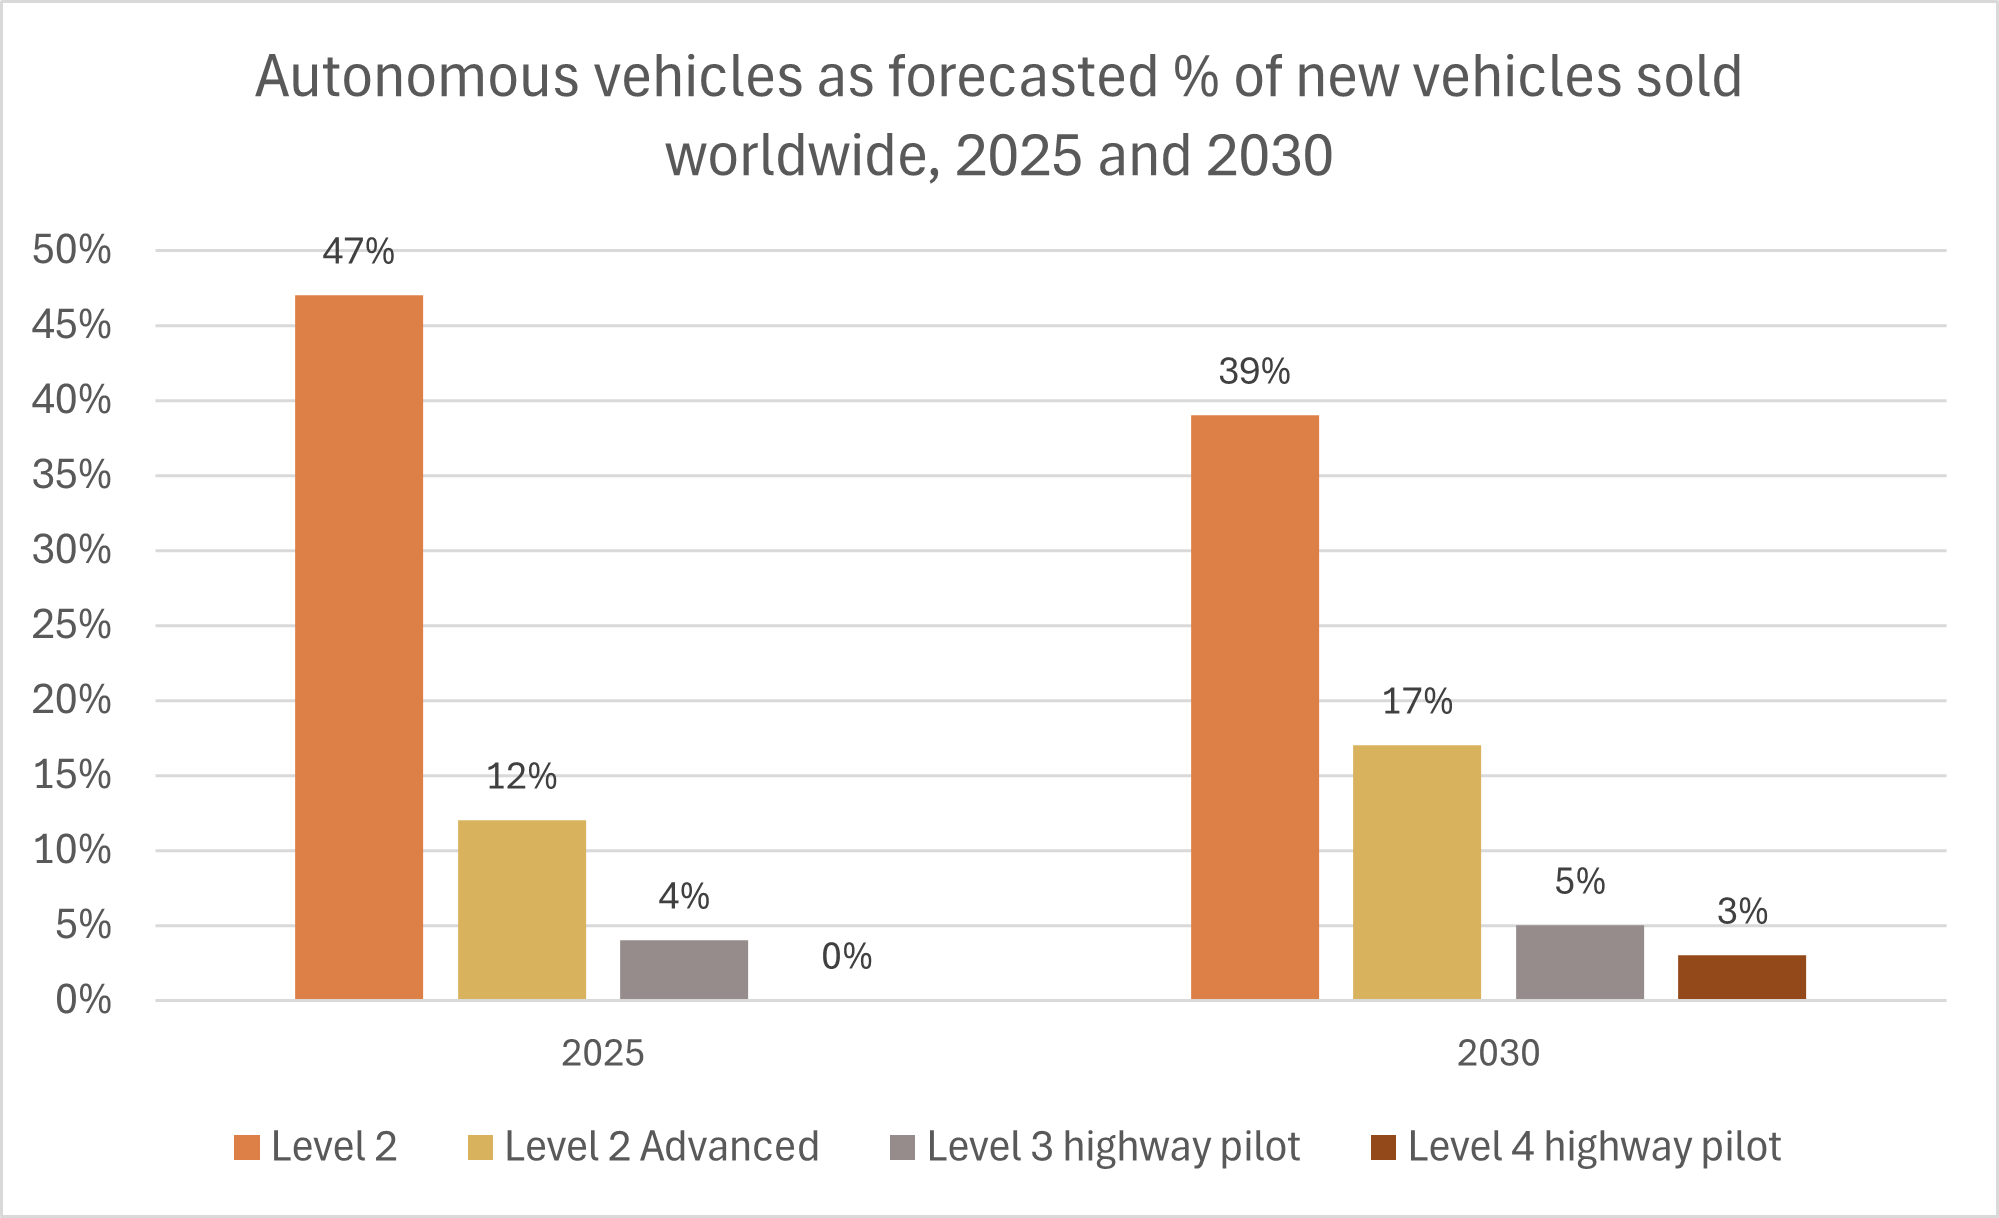
The upper bound on Level 2 vehicle sales in 2024 is likely to be much higher, because roughly half of all new cars sold in the US in 2024 were equipped with Level 2 automation.
|
Insurance Coverage Type |
Forward Emergency Braking (FEB) |
Intelligent Cruise Control (ICC) + FEB |
ProPILOT Assist + ICC and FEB |
Blind Spot Warning / Rear Cross-Traffic Alert |
Around View Monitor / Moving Object Detection |
Rear Automatic Braking / Rear Sonar System |
|
Collision |
-2.2% |
-1.9% |
1.1% |
-4.7% |
-1.7% |
-13.5% |
|
Property damage liability |
-7.8% |
-4.1% |
-5.6% |
-11.6% |
-6.5% |
-31.0% |
|
|
|
|
|
|
|
|
|
Bodily injury liability |
-14.2% |
-5.1% |
-13.1% |
-8.9% |
-17.9% |
-21.5% |
|
Medical payment |
4.0% |
-4.5% |
-19.1% |
-13.1% |
-13.6% |
14.5% |
|
Personal injury protection |
0.1% |
6.9% |
5.0% |
-3.4% |
-14.8% |
0.6% |
Other Vehicle Safety Equipment Statistics
Motorcycles
Bicycles
Pedestrians
|
Approach |
Estimated Factor |
Standard Error |
|
PHB+AS |
0.432 |
0.134 |
|
Pedestrian Hybrid Beacon (PHB) |
0.453 |
0.167 |
|
Rectangular Rapid Flashing Beacon (RRFB) |
0.526 |
0.377 |
|
Refuge Islands |
0.685 |
0.183 |
|
Advance Stop Indication (AS) |
0.750 |
0.230 |